Follow-up to: The Cycle of Order and Disorder & the Challenge of LLMs (March 2025)
TL;DR
- The premise mostly holds, with corrections. Public debt is heading for 100% of world GDP by 2029, warming is unambiguous and AI-safety rollback is well documented, but total debt/GDP is below its 2020 peak, Reinhart and Rogoff’s 90% debt threshold does not hold, and the timing of an AMOC collapse is contested.
- Most of the explanation already exists, spread across disciplines. My “local benefit versus generalised harm” crossover is Granovetter’s (1978) threshold and the crisis hypothesis of reform (Drazen & Grilli, 1993). What I could not find named anywhere is the claim that the benefit side is counted only inside a person’s circle of trust.
- People often already agree and do not know it. 69% of people worldwide would give 1% of income for climate action, yet people underestimate that support by about 26 points. The bottleneck is usually coordination, misperception and insulated elites, and much less often private arithmetic.
- The share of a population needed to tip does not grow with its size, but the time to tip can. Chenoweth’s 3.5% is a rule of thumb, not a law. Crisis alone does not produce reform: only 31% of historical crises saw any. My hypothesis, still untested, is that reform comes when harm reaches the people who hold the veto.
- Causal AI can speed attribution, at a price. It can shorten the trail from harm back to cause, but a large, continuously updated causal model becomes opaque by scale, wears down the human skill needed to check it, and can end up as the hardest layer of all to unwind.
The Question Behind This Report
Three global problems are arriving together: record public debt, accelerating climate change, and a political pushback against AI ethics and safety. All three were foreseen, and each spreads its harms unevenly. So why do societies put off dealing with problems like these until the last moment?
This report follows my essay “The Cycle of Order and Disorder & the Challenge of LLMs” (March 2025). My hypothesis is that people keep supporting a system while the benefit it gives them and their circle of trust is larger than the general harm they perceive it doing, and that they act only when the two cross.
The report asks four questions. Does an established term already exist for this mechanism? How does the shift in sentiment needed for action scale with the size of a population? How large is the hidden “iceberg” of private support beneath the protest anyone can see? It then follows what happens downstream when the root cause is left alone, and whether causal AI can help.
The essay leaned on several frameworks: Actor-Network Theory (Callon and Latour’s “translation”), reification, simulacra, and Brian Klaas’s sandpile, or self-organised criticality, metaphor, in which “a single additional grain can trigger an avalanche”. The sandpile is the physical cousin of the threshold-cascade models in Part C. Those models make the intuition precise: a system can sit close to a critical state for a long time and then reorganise all at once.
On method: I tried to refute every substantive claim against a primary or authoritative source. Each claim ended up in one of three states. It was confirmed, because the source supported this specific claim and my attempt to refute it failed. It was corrected, because an authoritative source contradicted it, and the correction is stated in the text. Or it stayed unverified, because I could not check it, the only source was weak, or credible sources disagreed, and the text says so where it matters. Where an argument is my own synthesis and not an established finding, I say so.
The Short Version
- The premise mostly holds, with corrections.
- Debt. Debt is at record dollar levels, and public debt is rising towards 100% of world GDP by 2029, a level last seen after the Second World War. But total debt/GDP is about 23 percentage points below its 2020 peak, and private debt/GDP is at its lowest since 2015. The well-known 90% threshold beyond which debt supposedly harms growth (Reinhart and Rogoff) does not hold up (Herndon et al., 2014). The “too much finance” threshold, private credit at around 100% of GDP (Arcand et al., 2015), is contested.
- Climate. Warming is unambiguous: 2023-25 were the three warmest years on record, and 2024 was about 1.55 °C above pre-industrial. A very strong, possibly record, El Niño is under way in 2026. How ENSO will change under warming, and whether the AMOC has already declined or when it might collapse, are open questions in the peer-reviewed literature.
- AI safety. The 2025-26 pushback is well documented: the US and UK renamed their AI safety institutes, the Biden-era AI executive order was revoked, the US moved to pre-empt state AI laws, the Pentagon designated Anthropic a “supply chain risk”, and the EU AI Act’s high-risk obligations were delayed. Counter-movements exist: the US Senate voted 99-1 against a moratorium on state AI laws, California enacted SB 53, and majorities of the US public want more regulation.
-
Most of the explanation already exists, scattered across disciplines. My crossover is, almost word for word, how Granovetter (1978) defines an individual’s threshold: “the point where net benefits begin to exceed net costs for that particular actor”. The nearest named theory in political economy is the crisis hypothesis of reform (Drazen & Grilli, 1993), built on Alesina and Drazen’s (1991) war of attrition, where reform comes only once the welfare loss from the status quo “dwarfs” each group’s loss from reforming. The “personal circle” corresponds to particularised trust (Uslaner, 2002), Fukuyama’s radius of trust as measured by Delhey et al. (2011) and, at the extreme, amoral familism (Banfield, 1958). A threat that is foreseen and still ignored is a predictable surprise (Bazerman & Watkins, 2004); stretched over time it is a tragedy of the horizon (Carney, 2015) and a super wicked problem (Levin et al., 2012). I found no single term that joins “the benefit is counted inside the trust radius” to “act only at the crossover against generalised harm”. The closest composite is crisis-induced reform under particularised trust.
-
The evidence partly contradicts the hypothesis, and the model in Part B is built around the corrections. Majorities already support climate action in private: 69% of people worldwide would give 1% of their income, and 89% want more political action. Yet people underestimate how many others agree by about 26 percentage points (Andre et al., 2024). That is pluralistic ignorance, not a sum of individual benefits, so the binding constraint is often coordination and perception, plus elites insulated from the harm (Diamond, 2005; Alesina & Drazen, 1991). Local harm moves opinion only a little, briefly and through a partisan filter. Wildfire exposure raised pro-environment votes by 5-6 points within 5 km, mostly in Democratic areas (Hazlett & Mildenberger, 2020), and baselines reset within 2-8 years (Moore et al., 2019).
-
The tipping fraction does not grow with population; the time to tip does (Part C). In the standard models (Granovetter’s thresholds, committed-minority naming games, Centola’s convention experiments) the critical fraction does not depend on population size \(N\), so the absolute number needed grows roughly linearly with \(N\). But the time to tip does depend on \(N\): below the critical committed fraction, the time to consensus grows exponentially with \(N\), and above it only as \(\ln N\) (Xie et al., 2011). On networks, the threshold depends on the share of each person’s neighbours and the spread of connections rather than on \(N\) (Watts, 2002). If people respond to absolute counts, as Granovetter allows, the fraction needed falls roughly as \(1/N\). Olson’s claim that larger groups fail to act holds only when costs rise with group size (Oliver & Marwell, 1988), and laboratory evidence contradicts it for large groups (Isaac et al., 1994). Chenoweth’s 3.5% figure describes maximalist campaigns and is not a law: 83% of successful campaigns stayed below 3.5%, and Bahrain failed with more than 6% (Chenoweth, 2020a).
-
The iceberg is real and has a name. Chenoweth herself writes that peak participation “is usually the tip of the iceberg”. Kuran’s (1995) preference falsification and the survey work on pluralistic ignorance measure the hidden part. A 2026 study complicates the picture: people overestimate how many others do rare, costly things such as donating or political engagement, and correcting that misperception did not change actual donations (Tiede et al., 2026).
-
In deep history, the Montreal Protocol is an exception for novel global threats, and only partly pre-emptive (Part D). Pre-emption is common against recurrent, local, visible hazards on a bounded commons (water boards, quarantine, alpine commons, granaries) and rare against novel, diffuse threats whose costs fall outside the decision-makers’ circle: my estimate is 5-25%, a judgement rather than a measurement. Ostrom’s (1990) enduring commons are the cases where the trust radius covers the whole commons. That fits the mechanism, but Ostrom chose long-lived cases and measured membership boundaries, not trust, so it supports the idea without confirming it.
-
The mechanism covers a plurality, probably a majority, of slow-onset problems with diffuse harm and concentrated benefit, but not every system (Part E). In a catalogue of 33 cases across 10 domains, 79% were late, failed or still unresolved. The full four-part mechanism is clearly needed in about a third of them. In another two-fifths, the benefit to incumbents plus a veto held by a few decision-makers is enough. Systems with immediate, attributable feedback, such as aviation safety and drug recalls, mostly work without drama.
-
Crisis is neither necessary nor sufficient for reform (Parts D and E). Reform is uncorrelated with crisis severity, both in CrisisDB, where only 31% of crises saw any reform (Hoyer et al., 2026), and in a global panel of disaster policy. Under partisan filtering a crisis can even strengthen the veto: mass shootings have been followed by looser gun laws. The model in Part B proposes instead that reform follows when harm reaches the veto holders’ own circle. The Great Stink, the Dust Bowl and Montreal fit this, but it is a hypothesis, untested on unselected data (P4).
-
Unresolved root causes pile up downstream (Part G). Harm travels down causal chains that cross domains, attribution weakens at each link, and those who carry the downstream costs hold no veto at the root. In all four current chains I coded (French debt, California wildfire, social media, obesity), most enacted policy sits at the nearest attributable, lowest-veto link: a pattern in cases I chose, not a measured rate. In the resolved historical chains (tobacco, lead, CFCs), action at the root followed a carrier that moved the costs into the veto holders’ circle: state Medicaid suits and the 1998 settlement, independent lead research, a US valuation of ozone loss in skin cancers. Each symptomatic fix creates beneficiaries who join the veto, and the layers can turn a tractable problem into a wicked one. No source names this accreted wickedness, though each part is established: policy feedback (Pierson, 1993), layering, and policy accumulation (Adam et al., 2019). No study measures how often accumulated policy is unwound wholesale without a crisis; for single programmes, about 10% of US domestic programmes end within a decade.
- Causal AI offers a way out, at a cost (Part H). Causal models, causal discovery and digital twins (names for a class of model, with no claim that causes are things) could slow the loss of attribution along chains, stand in partly for a mandate that spans domains, and hold institutional memory. Attribution tools already create carriers. In Lliuya v RWE, the Hamm Higher Regional Court held in May 2025 that a major emitter’s liability under German property law is not excluded in principle. It adopted its own experts’ site-specific estimate of about a 1% flood risk over 30 years, rejected abstract “climate factors” as a basis, and dismissed the appeal. No damages were awarded. Pharmacovigilance detects drug-safety signals routinely. Where harm is delayed and incumbent benefit large, detection is rarely the bottleneck: rofecoxib’s heart-attack signal came four years before its withdrawal.
- Two limits cannot be engineered away. Observational data cannot answer interventional questions without assumptions or experiments (Bareinboim et al., 2022), and a model retrained on a world it has helped shape converges to points that are stable but need not be true (Perdomo et al., 2020). Partisan filtering, capture, binding vetoes and data silos are governance risks on top.
- The largest risk arises if causal AI succeeds. A large, continuously updated causal model is opaque by scale, updating it to follow drift removes the fixed reference that tracing needs, and the human ability to trace atrophies, as automation research predicts (Bainbridge, 1983). Air France 447 is one case; in an observational study, endoscopists’ adenoma detection fell from 28.4% to 22.4% after exposure to AI (Budzyń et al., 2025). Keeping that capacity is part of institutional memory, which the model predicts will be cut under fiscal pressure; US manual-flying guidance is advisory and its uptake was never measured. The model then becomes the most complete accreted layer, and its operators the obligatory passage point for what counts as a cause.
- This is Latour’s (1999) blackboxing, technical work “made invisible by its own success”, as developed by Law, Callon, Akrich and Star, and by Callon and MacKenzie on performativity. In these terms the report’s own variables (the veto, the local benefit, the trust radius, institutional memory) are network effects bundled into single objects, and carriers are what open them up again.
What Is New Here and What Is Not
Most of this report rests on existing research. Some of it extends that research, and a small part is, as far as I can tell, new. “New” here means I searched for a precedent and did not find one. That is a judgement from absence, not proof. A few terms recur below: \(V\) is the veto held by decision-makers, \(L^R\) is the local benefit counted within the trust radius, \(H\) is the generalised harm, \(\varphi\) is the weight a person gives to harm (which decays with time and distance), \(\hat r\) is a person’s estimate of how many others share their view, and \(M\) is institutional memory.
Claims I Could Not Find Anywhere Else
These are my synthesis and are untested.
| Claim | Nearest existing work |
|---|---|
| The trust radius defines whose benefit is counted, so its size sets when the crossover happens (Part B). | Uslaner (2002); Delhey et al. (2011); Drazen & Grilli (1993) |
| The trust radius enters three terms at once: whose benefit counts, how fast perceived harm decays with distance, and how much people stay silent. | Matthes et al. (2018) on silencing within close circles |
| A single formal model combining a cascade threshold, a biased \(\hat r\), a radius-bounded benefit, an elite veto that responds to events, and a time to tip that scales with \(N\) (Part E). | Platt (1973); Kuran (1995); Søgaard Jørgensen et al. (2024) |
| Accreted wickedness: symptomatic layers plus a growing veto of their beneficiaries turn a tractable problem into a wicked one (Part G). | Adam et al. (2019); Pierson (1993); Rayner & Howlett (2009); Wildavsky (1979) |
| Carriers as the actors who decide when a root cause is finally reached (Part G). | Birkland’s (1998) focusing events; Alesina & Drazen’s (1991) cost of delay to groups |
| A successful causal model as the most complete accreted layer: opaque by scale, untraceable because it keeps updating, backed by a shrinking reserve of human tracing, with its operators deciding what counts as a cause (Part H). | Bainbridge (1983); Latour (1999); Callon (1986); Sculley et al. (2015); Messeri & Crockett (2024) |
Claims That Extend Existing Work
-
The veto depends on how exposed elites are to the harm:
\[V = V_0 - \gamma H_{\text{elite}} + \delta L^R_{\text{elite}} + \sigma \Pi\]This builds on Alesina and Drazen (1991), Drazen and Grilli (1993) and Diamond’s (2005) elite insulation, and adds which costs count and a polarisation term \(\Pi\) (Part B).
- An institutional-memory term \(M\) that resists shifting baselines, building on Pauly (1995), Moore et al. (2019) and Riris et al. (2024).
- An exit branch: reform may never come, and displacement or collapse can take its place (Hirschman, 1970; Hoyer et al., 2026).
- The scaling of time to tip with \(N\) as a formal version of “the last moment” (Xie et al., 2011; Part C).
- An iceberg ratio \(I = s/a\), private supporters over active participants, discounted for pluralistic ignorance, building on Granovetter, Kuran and Chenoweth (Part C).
- Enduring commons are those whose trust radius matches the commons, and they decay when that match is breached (Ostrom, 1990; van Bavel et al., 2018; P10).
- Externality leakage: pre-emption inside one circle can export the harm to others, building on the idea of maladaptation (Barnett & O’Neill, 2010; P12).
- Attribution decays multiplicatively along multi-link chains that cross domains and start from an unaddressed policy root. Most of the loss happens at intervening agents, and responses settle at the attributable link with the weakest veto. This builds on Arnold’s (1990) traceability, on evidence that longer chains reduce blame (Engelmann & Waldmann, 2022) and that attribution passes through physical links (Hilton et al., 2010), with Senge (1990) and Kahn (1966) for the response side (Part G; P14).
- The failure to connect information across agencies as a loss of institutional memory, building on the 9/11 Commission, Vaughan (1996) and Tett (2015).
- The trade-off between drift and traceability: updating a model to follow drift removes the fixed reference tracing needs, and no update rate avoids both costs. This builds on Sculley et al. (2015) and on concerns about auditing systems that learn continuously. As an engineering observation it is not new (Part H).
- Reification as the cost of success: a reserve of human tracing capacity is a standing cost that gets cut under fiscal pressure, building on Bainbridge (1983), Latour (1999) and the late-Qing and Office of Technology Assessment cases in Part B.
- The model’s variables as bundled network effects that carriers can reopen (Law, 1992; Latour, 1986; Callon & Latour, 1981; Part H).
Claims That Agree With Existing Work Without Adding to It
The private crossover is Granovetter’s threshold, and delay until the cost of the status quo exceeds each group’s losses from reform is the war of attrition and the crisis hypothesis (Part B). Majorities underestimate support for climate action (Andre et al., 2024; Sparkman et al., 2022), though for rare, costly behaviours the share acting is overestimated (Tiede et al., 2026). Attribution weakens as a causal chain lengthens, and legislators anticipate how traceable an effect will be (Arnold, 1990; Mildenberger & Sahn, 2025; Engelmann & Waldmann, 2022). Shifting baselines and distance filter perceived harm (Pauly, 1995; Moore et al., 2019; Hazlett & Mildenberger, 2020). In proportional models the critical fraction does not depend on \(N\) (Part C).
Policy change follows a pattern of delay, then lurch (Jones et al., 2009). Incumbents lower the weight people give to harm by manufacturing doubt (Oreskes & Conway, 2010). Montreal worked because its circumstances were unusually favourable (Sunstein, 2007; Barrett, 2003). Financial crises are predictable and still not prevented (Greenwood et al., 2022). The Norse, Rapa Nui and Angkor “collapses” have been revised (Dugmore et al., 2012; Moreno-Mayar et al., 2024; Penny et al., 2019).
On the AI side: retraining handles drift but converges to performatively stable points that need not be optimal (Perdomo et al., 2020), and observational data alone cannot settle interventional questions (Bareinboim et al., 2022). Automation erodes unused skill and breeds complacency and bias (Bainbridge, 1983; Parasuraman & Manzey, 2010). Practising with an AI model impairs the formation of unassisted skill, and cognitive skills decay with disuse faster than physical ones (Bastani et al., 2025; Arthur et al., 1998; Casner et al., 2014). Performative prediction belongs with what MacKenzie (2006) calls Barnesian performativity (Hardt & Mendler-Dünner, 2023). And where harm is delayed and incumbents benefit a great deal, detection is rarely the bottleneck: rofecoxib and the tobacco chain both show this (Part H).
Claims That Cut Against Existing Work
Each of these is defensible on current evidence and each comes with the test that would settle it.
| Position challenged | My claim | Test |
|---|---|---|
| Olson’s group-size law as general | Larger groups are not in general less able to act. | Group-size effects should appear only where the cost of the good rises with \(N\) (P5; large-N public-goods experiments). |
| Chenoweth’s 3.5% as a law | It describes maximalist campaigns. | Campaigns after 2010 that peaked above 3.5% and still failed. |
| Crisis severity as the trigger for reform (Drazen and Grilli extended) | Reform follows harm reaching the veto holders’ circle. | P4 and P16: elite exposure and the emergence of carriers against severity. |
| Rittel and Webber’s (1973) view that wickedness is intrinsic | Some wickedness is made by layers of policy. | P17 and P20: wickedness and failure to unwind rising with the number of layers within a domain. |
| Reading Lawrence et al. (2024) as showing no shared mechanism in the polycrisis | One micro-mechanism of delay operates across systems. | P1: coding the parameters across domains in advance. |
| Diamond’s (2005) collapse cases | Rapa Nui, the Norse and Angkor show adaptation or gradual change, not chosen failure. | Further genomic and archaeological dating. |
| Sen’s no-famine law as absolute | A free press and elections weaken the veto but do not guarantee action. | Famine incidence in electoral democracies with a free press. |
| “Causal AI opens the black box” (advocacy, for example in the Stanford Social Innovation Review) | An explicit causal graph is transparent by design but opaque through scale and update rate. | P23, and measured time and success of human tracing of outputs from large deployed causal models. |
| Better attribution as a direct route to root reform | Attribution speeds up carriers, but reform still waits for the veto conditions. | P22. |
| Correcting misperceived norms as a general lever | Correcting misperceived support raises action only where the barrier is social, the step is cheap and the target is below the norm. | P3. |
The last row qualifies this report as well as the advocacy literature, since Part B and point 3 above lean on correcting \(\hat r\) as a lever. The evidence against treating it as general is null or backfiring results in pension enrolment (Beshears et al., 2015), actual climate donations (Tiede et al., 2026), college drinking (Foxcroft et al., 2015) and health messaging once bias is corrected for (Papakonstantinou et al., 2025).
Part A: Validating the Premise
My starting essay rested on three claims about the present: that debt is ballooning, that the climate system is moving towards dangerous thresholds, and that the people warning about AI are being pushed aside. Before asking why societies wait, I checked each claim against primary sources.
A.1 Debt and Financialisation
| Finding | Source and status |
|---|---|
| Total global debt in 2024 was “just above 235 percent” of world GDP: USD251 trillion, of which USD99.2 trillion was public. Public debt is “nearly 93 percent” of GDP. Private debt is “under 143 percent”, its lowest level since 2015. Total debt peaked at 258% in 2020. US general government debt is 121% of GDP. | International Monetary Fund [IMF] (2025), Global Debt Database, data for 2024 |
| Global public debt was 93.9% of GDP in 2025. The IMF projects 95.3% in 2026 and 100% in 2029, a level previously reached only after the Second World War. Interest costs are about 3% of global GDP, up from 2% four years earlier. The global “fiscal buffer” has fallen to near zero, and debt-at-risk is approaching 117% of GDP. | IMF (2026), Fiscal Monitor, April 2026 |
| Global debt reached a record USD365.5 trillion in the first half of 2026. Debt/GDP is about 25 percentage points below its 2021 peak, mainly because inflation has raised nominal GDP. Emerging-market government debt is 76.8% of GDP. | Institute of International Finance (IIF, 2026). Unconfirmed: the report is paywalled and I saw these figures only in press summaries (Investing.com, bne IntelliNews). |
| Financialisation is “a pattern of accumulation in which profits accrue primarily through financial channels rather than through trade and commodity production”. | Krippner (2005, p. 174) |
| Financial depth starts to reduce output growth once private credit reaches about 100% of GDP. The earlier 2012 working paper put the turning point at 80-100%; a later “redux” on 1960-2019 data puts it at 70-120%. | Arcand et al. (2015) |
| Whether excess finance causes lower growth is disputed. Cline (2015) shows that any variable rising with income will produce a spurious quadratic “too much” turning point (his analogy is “too many doctors”). The original authors replied in 2015 that their result holds. | Unresolved: the critique and the reply conflict, and I could not settle it. |
| Reinhart and Rogoff claimed that growth falls sharply once public debt exceeds 90% of GDP. That threshold does not hold. A reanalysis of their own data found coding and weighting errors, a gentler negative relationship, and no identifiable threshold. | Herndon et al. (2014) |
The premise as I first stated it, “debt/GDP is ballooning”, is partly wrong. Public debt/GDP is rising. Total debt/GDP has fallen since 2020, and private debt/GDP is at a decade low (IMF, 2025). The accurate version is that public debt is rising towards post-war records, dollar totals are at record highs, and the burden of servicing debt is growing.
Several things here are well established: record nominal debt, public debt rising towards 100% of GDP, rising interest burdens, and the shift of US profits towards financial channels since the 1970s that Krippner documents. Three things are contested: whether there are thresholds beyond which debt or finance becomes harmful; whether total leverage is still “ballooning” (relative to GDP it is not); and causal identification in regressions of growth on finance.
A.2 Global Warming, ENSO and the AMOC
| Finding | Source and status |
|---|---|
| 2024 is the warmest year on record, about 1.55 °C (±0.13) above 1850-1900. 2025 was about 1.43 °C, second or third warmest depending on the dataset, even with La Niña conditions. The 11 years 2015-2025 are the 11 warmest on record, and 2023-2025 average about 1.48 °C. Earth’s energy imbalance reached a record in 2025. | World Meteorological Organization [WMO] (2026a), State of the Global Climate 2025, released 23 March 2026; WMO update for COP30 |
| The WMO declared the onset of El Niño on 2 June 2026. On 3 September 2026 it gave a likelihood of “nearly 100%” that the event would persist through February 2027 and said it would reach “very strong intensity”, possibly “off the charts”. On 10 September the NOAA Climate Prediction Center gave a greater than 90% chance of a very strong event, and a 75% chance of a “historic” event exceeding every event since 1950 in October-December 2026. | WMO (2026b); NOAA Climate Prediction Center (2026) |
| The Intergovernmental Panel on Climate Change [IPCC] finds “no model consensus for a systematic change in intensity of ENSO SST variability” (medium confidence). ENSO rainfall variability, however, will very likely increase in the second half of the century under SSP2-4.5 and higher scenarios. | IPCC (2021), Working Group I, ch. 4 and Summary for Policymakers B.3.2 |
| Models project that extreme El Niño events, defined by rainfall, roughly double under RCP8.5. | Cai et al. (2014, 2017) |
| Whether the observed tropical Pacific is moving towards an El Niño-like state is disputed. Observations show a strengthening east-west sea-surface temperature gradient, which is La Niña-like and which most CMIP models fail to reproduce. Proposed explanations include the models’ cold-tongue bias, internal variability and Atlantic teleconnections. | Unresolved: Seager et al. (2019) and a 2026 Nature Communications study conflict with CMIP6 projections. |
| The IPCC says the AMOC “will very likely decline over the 21st century for all SSP scenarios. There is medium confidence that the decline will not involve an abrupt collapse before 2100.” The projected decline by 2100 is 24% (range 4-46%) under SSP1-2.6 and up to 39% (17-55%) under SSP5-8.5. | Fox-Kemper et al. (2021), IPCC Working Group I, ch. 9; Summary for Policymakers C.3.4 |
| Has the AMOC already weakened? Studies using sea-surface temperature fingerprints say yes, with a decline over about 70 years (Caesar et al., 2018). Using air-sea heat fluxes, Terhaar et al. (2025) find “no decline since the 1960s” in the decadal-mean AMOC at 26.5°N, although the uncertainty in the reanalysis data is large. | Unresolved: the two lines of evidence conflict. |
| Ditlevsen and Ditlevsen (2023) estimate a collapse between 2025 and 2095 (95% interval), with a central estimate of 2057. Their proxy and statistical assumptions have drawn substantial criticism, from Reschenhofer and from experts quoted by the Science Media Centre. | Unresolved: conflicts with Baker et al. (2025) and with methodological critiques. |
| CMIP models show no full AMOC collapse before 2100, even under extreme forcing, because wind-driven upwelling in the Southern Ocean sustains some sinking in the North Atlantic. Large weakening still occurs. | Baker et al. (2025) |
| In extended CMIP6 runs, deep convection collapses and the northern AMOC shuts down after 2100 in 67% of very-high-emission runs, 30% of medium-emission runs and 25% of low-emission runs. The authors argue that the IPCC’s “low-likelihood” framing should be revised in the next assessment report. | Drijfhout et al. (2025) |
| The AMOC can tip because of the rate of forcing. With a slow CO₂ ramp it stays stable up to +5.5 °C; with fast ramps it collapses at about +2 °C. A single “temperature threshold” may therefore mislead. | van Westen et al. (2026) |
| The Global Tipping Points Report 2025 says warm-water coral reefs are “crossing” their thermal tipping point (central estimate 1.2 °C, range 1-1.5 °C). The International Coral Reef Society says the point of no return has not yet been reached. | Unresolved: the report is not a journal assessment, and the coral society disputes it. |
| “Global polycrisis” has a scholarly definition: “the causal entanglement of crises in multiple global systems in ways that significantly degrade humanity’s prospects”. It works through common stresses, domino effects and feedbacks between systems. This is the established name for what my essay called “several simultaneous global challenges”. | Lawrence et al. (2024) |
Well established: warming of about 1.4-1.55 °C, a run of record years, a very strong El Niño in 2026, projected weakening of the AMOC this century, and greater ENSO rainfall variability.
Contested:
- the direction of the observed tropical Pacific trend, and whether warming changes ENSO amplitude;
- whether the AMOC has already declined;
- whether a full collapse happens this century. Ditlevsen and Ditlevsen say it is likely; Baker et al. say no; Drijfhout et al. find shutdown after 2100 common under high emissions; van Westen et al. say it depends on how fast forcing rises.
The AMOC literature is converging on a position between “imminent collapse” and “nothing to see”: substantial weakening is likely, full collapse is a real but uncertain tail risk, and the timing depends on how fast emissions rise.
A.3 Pushback Against AI Ethicists and Safety Experts
| Finding | Source and status |
|---|---|
| Google dismissed Timnit Gebru on 2 December 2020 after a dispute over the “Stochastic Parrots” paper (presented at FAccT 2021). Google said it “accepted her resignation”. Margaret Mitchell was fired on 19 February 2021. | Bender (2022); Hao (2020) |
| In May 2024 Jan Leike, co-lead of OpenAI’s Superalignment team, resigned, writing that “safety culture and processes have taken a backseat to shiny products”. The team was disbanded within days. | Leike (2024), as reported by Wired and IEEE Spectrum |
| Executive Order 14148 (20 January 2025) revoked President Biden’s Executive Order 14110. Executive Order 14179 (23 January 2025), “Removing Barriers to American Leadership in AI”, ordered reviews of actions taken under 14110 and required an AI Action Plan, which was published in July 2025. | Executive order texts, as summarised by OECD.AI and law firms |
| At the Paris AI Action Summit on 11 February 2025, JD Vance said: “The AI future is not going to be won by hand-wringing about safety.” He also said: “this doesn’t mean… that all concerns about safety go out the window”. The US declined to sign the summit declaration. | Vance (2025), US Embassy transcript |
| The UK AI Safety Institute became the AI Security Institute on 14 February 2025 and dropped its work on bias and freedom of speech. The US AI Safety Institute became the Center for AI Standards and Innovation on 3 June 2025. Commerce Secretary Lutnick: “censorship and regulations have been used under the guise of national security.” | UK Parliament (2025); US Department of Commerce (2025) |
| The executive order “Ensuring a National Policy Framework for AI” (11 December 2025) created a Department of Justice “AI Litigation Task Force” to challenge state AI laws, and tied some federal grants to states avoiding “onerous” AI laws. In March 2026 the White House sent Congress a legislative framework proposing broad pre-emption of state law. | Order text, as summarised by Mayer Brown, Latham & Watkins and Lawfare |
| On 27 February 2026 the Defense Secretary designated Anthropic a “supply chain risk” after it refused to allow uses for mass domestic surveillance and fully autonomous weapons. The President ordered agencies to stop using Anthropic’s models. The designation was formalised in March. | Contemporary news reports (CBS News; Axios) and law-firm analyses (Mayer Brown; Venable) |
| A divided D.C. Circuit panel reportedly upheld the designation 2-1 (Judge Katsas writing) around late September 2026. | Unconfirmed: reported by a single outlet of low reliability. |
| In October 2026 OpenAI fired the safety researchers Korbak, Balesni and Wang. The researchers say they were dismissed for raising safety concerns and for contacting METR. OpenAI cites a “significant breach of trust” and says the dismissals were “not about raising safety concerns”. | Unconfirmed: the facts are actively disputed between the parties. |
| The EU’s Digital Omnibus on AI (provisionally agreed 7 May 2026, final European Parliament vote 16 June 2026) delays the Annex III high-risk obligations to 2 December 2027 and the Annex I obligations to 2 August 2028. The Article 50 transparency obligations keep their August 2026 date. This is a delay, not a repeal. | Analyses of the adopted text by Gibson Dunn, Morgan Lewis and Hogan Lovells |
| Counter-evidence: the Senate struck the proposed 10-year moratorium on state AI laws by 99 votes to 1 on 1 July 2025, with 17 Republican governors and 40 attorneys general opposed. California’s SB 53, on frontier AI transparency, was signed on 29 September 2025 and took effect on 1 January 2026. | US Senate Committee on Commerce, Science, and Transportation (2025); analyses by FPF and White & Case |
| About 6 in 10 US adults and 56% of AI experts worry more that government will not go far enough in regulating AI than that it will go too far (surveys fielded in 2024). A Pew poll in September 2025 found 57% rate AI’s risks to society as high. | Pew Research Center (2025) |
| Calling this a global pushback overstates it. The evidence is concentrated in the US federal executive, with the UK following and the EU delaying. China signed the Paris declaration, and US states and Congress have partly resisted. | My judgement; I did not consult a systematic cross-national dataset. |
Well established: the dismissals and departures of 2020-2024; a sharp change in the posture and vocabulary of the US federal government in 2025-2026, where “safety” gave way to “security”, “innovation” and “dominance”; the renamed institutes; a federal campaign to pre-empt state law; the Anthropic designation; and the EU delays.
Contested: the motives behind specific firings; whether this is opposition to safety or opposition to regulation and to “woke” AI (officials say the latter); and whether it is global or largely American. The pushback does not reflect public opinion, since US majorities want more regulation. That fits the wider claim in my essay that elites insulated from consequences can delay action against majority preference (see Diamond, and Alesina and Drazen, in Part B).
Part B: Why Societies Wait Until the Last Moment
B.1 The Hypothesis, Stated Formally
My hypothesis, in paraphrase: individual \(i\) keeps supporting a system (credit, fossil energy, an AI tool) while the localised net benefit \(L_i(t)\), accrued inside \(i\)’s circle of particularised trust, exceeds the perceived generalised harm \(H_i(t)\) of the wider challenge. Collective action begins only when, for enough people, \(H_i(t) > L_i(t)\). This holds even though harms and benefits are unevenly distributed, the threat was foreseen, and distant others face existential consequences.
A compact model that combines my terms with Granovetter’s:
\[\text{act}_i(t) = \mathbb{1}\big[\, \underbrace{H_i(t) - L_i(t)}_{\text{private crossover}} \;+\; \beta\, \hat r_i(t) \;>\; \kappa_i \,\big]\]Here \(\hat r_i(t)\) is \(i\)’s perceived share of others already acting (the social component), \(\beta\) is susceptibility to that social signal, and \(\kappa_i\) is the personal cost of acting. Each term corresponds to a body of literature:
- \(L_i\) restricted to the trust radius: Uslaner, Fukuyama, Banfield.
- \(H_i\) discounted by distance and time: Carney, Weber, Gardiner.
- The baseline against which \(H_i\) is judged drifts: Pauly, Moore et al.
- \(\hat r_i\) is biased downward: Kuran, Sparkman et al., Andre et al.
- Elites with large \(L_i\) and small \(H_i\) can veto: Diamond, Alesina and Drazen.
B.2 Mapping Each Element of the Hypothesis to Named Concepts
| Element of the hypothesis | Closest named concept | What the source says | Fit |
|---|---|---|---|
| Act only when the net benefit of acting turns positive | Threshold (Granovetter, 1978) | A threshold is “the number or proportion of others who must make one decision before a given actor does so; this is the point where net benefits begin to exceed net costs for that particular actor” (p. 1420). | Very close; adds the social term |
| Reform is delayed until the costs of the status quo rise enough | War of attrition, or delayed stabilisation (Alesina & Drazen, 1991) | Groups try to shift the burden of stabilisation onto others, and stabilisation happens “only when one group concedes”. Higher costs of instability bring the date forward. Delay requires incomplete information about others’ costs. | Very close on mechanism, which is distributional |
| Pain must exceed one’s own distributional loss | Crisis hypothesis (Drazen & Grilli, 1993) | In a crisis, “the extreme welfare loss each agent suffers dwarfs the loss he may associate with an unfavorable distribution of the burden” of reform. The authors warn that crises are not socially desirable if policymakers are biased. (Quoted via a 2010 article in the Journal of Development Studies.) | The closest formal statement of my crossover |
| …and empirically, only at extremes | Tests of whether crises induce reform (Drazen & Easterly, 2001) | Evidence for the hypothesis appears only at extreme inflation or black-market premia, not for deficits or recessions. Crises must be “very deep”. | Supports “the last moment” for modern macroeconomic stabilisation only. It does not show that reform needs an extreme crisis in general (see B.4.1). |
| Uncertain winners resist reform | Status-quo bias from individual-specific uncertainty (Fernandez & Rodrik, 1991) | Reforms that would win ex post fail ex ante when individual gainers cannot be identified. No risk aversion or irrationality is needed. About 1,160 citations (Semantic Scholar). | Explains uneven distribution |
| Benefits computed inside personal circles | Particularised versus generalised trust (Uslaner, 2002, ch. 2) | Particularised trust is faith “only… in people like ourselves” and “restricts the size of our moral community”. Generalised trust is the belief that “most people can be trusted”. Uslaner compares the split to Putnam’s bonding and bridging capital. | Direct match |
| The size of that circle | Radius of trust (Fukuyama, 2001; Delhey et al., 2011) | In 41 of 51 countries “most people” means out-groups, but the radius varies widely. “Trust is only civic in nature when the radius is wide.” | Direct match, and measurable |
| Extreme particularism | Amoral familism (Banfield, 1958) | “Maximize the material, short-run advantage of the nuclear family; assume that all others will do likewise.” | The concept matches, but its empirical basis is disputed: Miller (1974) failed to support it |
| Short-termism and future victims | Tragedy of the horizon (Carney, 2015) | Climate change “imposes a cost on future generations that the current one has no direct incentive to fix”; its impacts fall “beyond the traditional horizons of most actors”. | Close, on the time axis |
| Foreseen but not acted on | Predictable surprise (Watkins & Bazerman, 2003; Bazerman & Watkins, 2004) | Disasters that leaders had the information to anticipate. Failure can occur at recognition, prioritisation or mobilisation, and has cognitive, organisational and political roots, including special interests. | Close, on the foreseen threat |
| The same | Gray rhino (Wucker, 2016) | A high-probability, high-impact, neglected threat. I did not check this source. | Close |
| Those causing the problem are also those solving it; no central authority; time running out | Super wicked problems (Levin et al., 2012) | Four features: time is running out; those causing the problem seek to solve it; central authority is weak or absent; policies “discount the future irrationally”. | Close, on structure |
| Global, intergenerational and theoretical dispersion; self-serving rationalisation | Perfect moral storm and moral corruption (Gardiner, 2006, 2011) | Causes and effects are dispersed, agency is fragmented and institutions are inadequate, with “generational buck-passing” on top. Together these make us vulnerable to “moral corruption”. | Close, on ethics |
| Elites benefit while others pay | Rational bad behaviour and elite insulation (Diamond, 2005, ch. 14) | “Some people may reason correctly that they can advance their own interest by behavior harmful to other people.” This is worst when elites are insulated from the consequences. Diamond’s road map of failure: to anticipate, to perceive, to try, and of solutions. I have seen this chapter only through reading notes and summaries. | Direct, for the uneven-distribution clause |
| Slow change goes unnoticed | Creeping normalcy and landscape amnesia (Diamond, 2005); shifting baseline syndrome (Pauly, 1995) | Each generation “accepts as a baseline the stock size… that occurred at the beginning of their careers”. Pauly’s note drew about 1,560 references in 25 years in Web of Science (Alleway et al., 2023). | Explains why \(H_i\) is under-perceived |
| Measured baseline drift | Empirical shifting baseline (Moore et al., 2019) | People judge “normal” weather against the weather of the previous 2-8 years. Extreme temperatures become less remarkable but not less harmful (the “boiling frog”). | Strong empirical support |
| Experience versus description | Experience-based risk perception and the finite pool of worry (Weber, 2006) | Visceral reactions depend on personal experience, so climate risk known only from description feels low. Concern about one risk can crowd out others. | Explains low \(H_i\) |
| Local pain moves behaviour | Effects of disaster exposure (Hazlett & Mildenberger, 2020) | A wildfire within 5 km raised support for costly climate ballot measures by 5-6 percentage points, decaying to about zero beyond 15 km, and only in Democratic areas. | Supports the “local” clause but shows a partisan filter |
| …but the effect is modest | Systematic review of 73 studies (Howe et al., 2019) | “Modest support” for a link between experience of weather and climate opinion. | Weakens the clause that pain will tip opinion |
| Defending the system that benefits me | System justification (Feygina et al., 2010) | System-justification tendencies mediate environmental denial. An intervention that framed change as “patriotic” did not replicate robustly in a later replication. | Explains attachment to \(L_i\) |
| In finance, good times breed fragility | Financial instability hypothesis (Minsky, 1992) | “Over periods of prolonged prosperity, the economy transits from financial relations that make for a stable financial system to financial relations that make for an unstable system” (p. 8), moving from hedge to speculative to Ponzi finance. | The credit version of the hypothesis |
| In finance, the last disaster is forgotten | Disaster myopia (Guttentag & Herring, 1986) | Lenders’ subjective probabilities of default fall during long favourable periods: “the worst of loans are made in the best of times”. | Close, for credit |
| When complexity stops paying, people defect | Declining marginal returns to complexity (Tainter, 1988) | When the marginal cost of complexity becomes too high, parts of society resist more or try to break away. (From excerpts published by the Schumacher Center.) | Matches “the benefit erodes, then people exit” |
| Group size defeats action | Logic of collective action (Olson, 1965) | “Unless the number of individuals in a group is quite small, or unless there is coercion… rational, self-interested individuals will not act to achieve their common or group interests” (p. 2). | Classic, but not a general law (see Part C) |
| Others will act, so I won’t | Diffusion of responsibility and the volunteer’s dilemma (Diekmann, 1985) | Diekmann formalises Darley and Latané. In equilibrium, each individual’s chance of volunteering falls as group size grows. Darley and Latané’s own data showed a slightly increasing chance that someone helps. | Partial support |
| Commons are destroyed | Tragedy of the commons (Hardin, 1968), against Ostrom (1990, 2010): communities with suitable institutions and polycentric governance can manage commons | Ostrom’s 2010 Nobel lecture is confirmed as a source. I did not re-read Hardin’s text, Ostrom’s critique of it or her design principles. | Ostrom shows the outcome is not inevitable |
| Too late to steer technology | Collingridge dilemma (Collingridge, 1980) | “When change is easy, the need for it cannot be foreseen; when the need for change is apparent, change has become expensive, difficult and time consuming.” (Quoted via Morozov, 2012, and Liebert & Schmidt, 2010.) | Exact, for AI |
| Fear of isolation silences dissent | Spiral of silence (Noelle-Neumann, 1974) | A meta-analysis found a very small effect, r ≈ .05 (Glynn et al., 1997). An updated meta-analysis finds r ≈ .10, with the strongest silencing, r ≈ .34, among family, friends and neighbours (Matthes et al., 2018). | Silence is strongest inside circles of particularised trust |
| Hidden private dissent | Preference falsification (Kuran, 1991, 1995) | Public and private preferences diverge under social pressure, so revolutions come as a surprise. The same falsification hides the forces at work even afterwards. | The core of the “iceberg” |
| Bystander effect, loss aversion, status-quo bias, hyperbolic discounting | Darley and Latané (1968); Kahneman and Tversky (1979); Samuelson and Zeckhauser (1988); Laibson (1997) | Standard behavioural mechanisms that raise \(\kappa_i\) and discount \(H_i\). These are classics I did not re-check. | Supporting |
| Punctuated change | Punctuated equilibrium (Baumgartner & Jones, 1993); policy windows (Kingdon, 1984); the Overton window | Long stasis, then rapid change when attention and the coupled “streams” align. Not re-checked. | Describes the shape of delay followed by a rush |
| Risk society, denial, exit and voice | Beck (1992 [1986]); Norgaard (2011); Jamieson (2014); Hirschman (1970); Putnam (2000); Fukuyama (1995); Olson (1982) | Manufactured risk; socially organised denial; exit versus voice when quality declines; bonding versus bridging capital; distributional coalitions. Not re-checked. | Supporting |
B.3 Does a Precise Named Term Exist?
I found no single established term for “benefit computed within particularised trust; act only when generalised harm exceeds it”. I searched for one, but that is absence of evidence, not proof that none exists.
The closest terms, by discipline:
- Economics: the crisis hypothesis (Drazen & Grilli, 1993), with the war of attrition (Alesina & Drazen, 1991) as the mechanism. This is the most precise match for “wait until the pain exceeds one’s own distributional gain”.
- Sociology and complexity: Granovetter’s threshold, which he defines as the net-benefit crossover.
- Political science and management: predictable surprise; super wicked problems.
- Trust research: the radius of trust and particularised trust, for the “circle”.
- Ethics: moral corruption within a perfect moral storm.
If a coinage is wanted, I suggest a radius-bounded crisis threshold: a Granovetter-type threshold in which the private benefit term is summed only over the trust radius, as Delhey et al. (2011) measure it, and the trigger follows the Drazen and Grilli crossover.
B.4 The Radius-Bounded Threshold Model
My original hypothesis made the private crossover \(H_i > L_i\) the binding constraint. The evidence shows that majorities often already privately favour action, so the crossover is one term but not the only bottleneck. Three more constraints complete the model: a perception filter on harm, a socially biased coordination term, and an elite or institutional veto. Population size governs the time to tip, not the fraction required.
In prose, societies delay addressing foreseen global challenges mainly because four mechanisms compound, and only secondarily because individuals value the incumbent system more than they fear the wider harm:
- Filtered harm. Each person perceives generalised harm through a filter. The filter discounts distance, resets to a shifting baseline within a few years, and passes through partisan and identity screens. Private concern therefore rarely becomes a felt crossover.
- Misperceived peers. People underestimate how many others share their concern (pluralistic ignorance), and silence is strongest inside circles of particularised trust. The social term that would tip them stays below threshold.
- Vetoes held by the insulated. Those with the largest localised benefit and the least exposure to harm hold veto power. Reform tends to arrive when a crisis raises the cost of the status quo to them, as in the war of attrition and the crisis hypothesis, or when they are displaced (B.4.1). It does not arrive when the median citizen’s crossover occurs.
- Metastability that grows with size. The fraction needed to tip a population does not depend on its size, but the time to tip from just below critical mass grows exponentially with size. Large societies can stay stuck for a long time and then reorganise abruptly. This is a formal account of “the last moment”.
The individual decision:
\[\text{act}_i(t) = \mathbb{1}\Big[\, \underbrace{\varphi_i\big(d_i,\; t - t^{\text{base}}_i,\; \pi_i\big)\, H_i(t)}_{\text{filtered generalised harm}} \;-\; \underbrace{L_i^{R_i}(t)}_{\text{benefit within trust radius } R_i} \;+\; \beta\, \underbrace{\big(r(t) - \delta_i\big)}_{\hat r_i:\ \text{perceived peers}} \;>\; \kappa_i \,\Big]\]- \(\varphi_i \in [0,1]\) is the perception filter. It falls with distance \(d_i\): the wildfire effect vanishes beyond about 15 km. It resets as the baseline \(t^{\text{base}}_i\) renormalises, over 2-8 years. It depends on partisan or identity alignment \(\pi_i\) (Hazlett & Mildenberger, 2020; Moore et al., 2019; Howe et al., 2019).
- \(\delta_i > 0\) is the bias from pluralistic ignorance. Worldwide, people underestimate true support by about 26 percentage points (Andre et al., 2024; Sparkman et al., 2022).
- \(L_i^{R_i}\) is summed only over \(i\)’s radius of particularised trust (Uslaner, 2002; Delhey et al., 2011, for the radius concept).
The collective reform time:
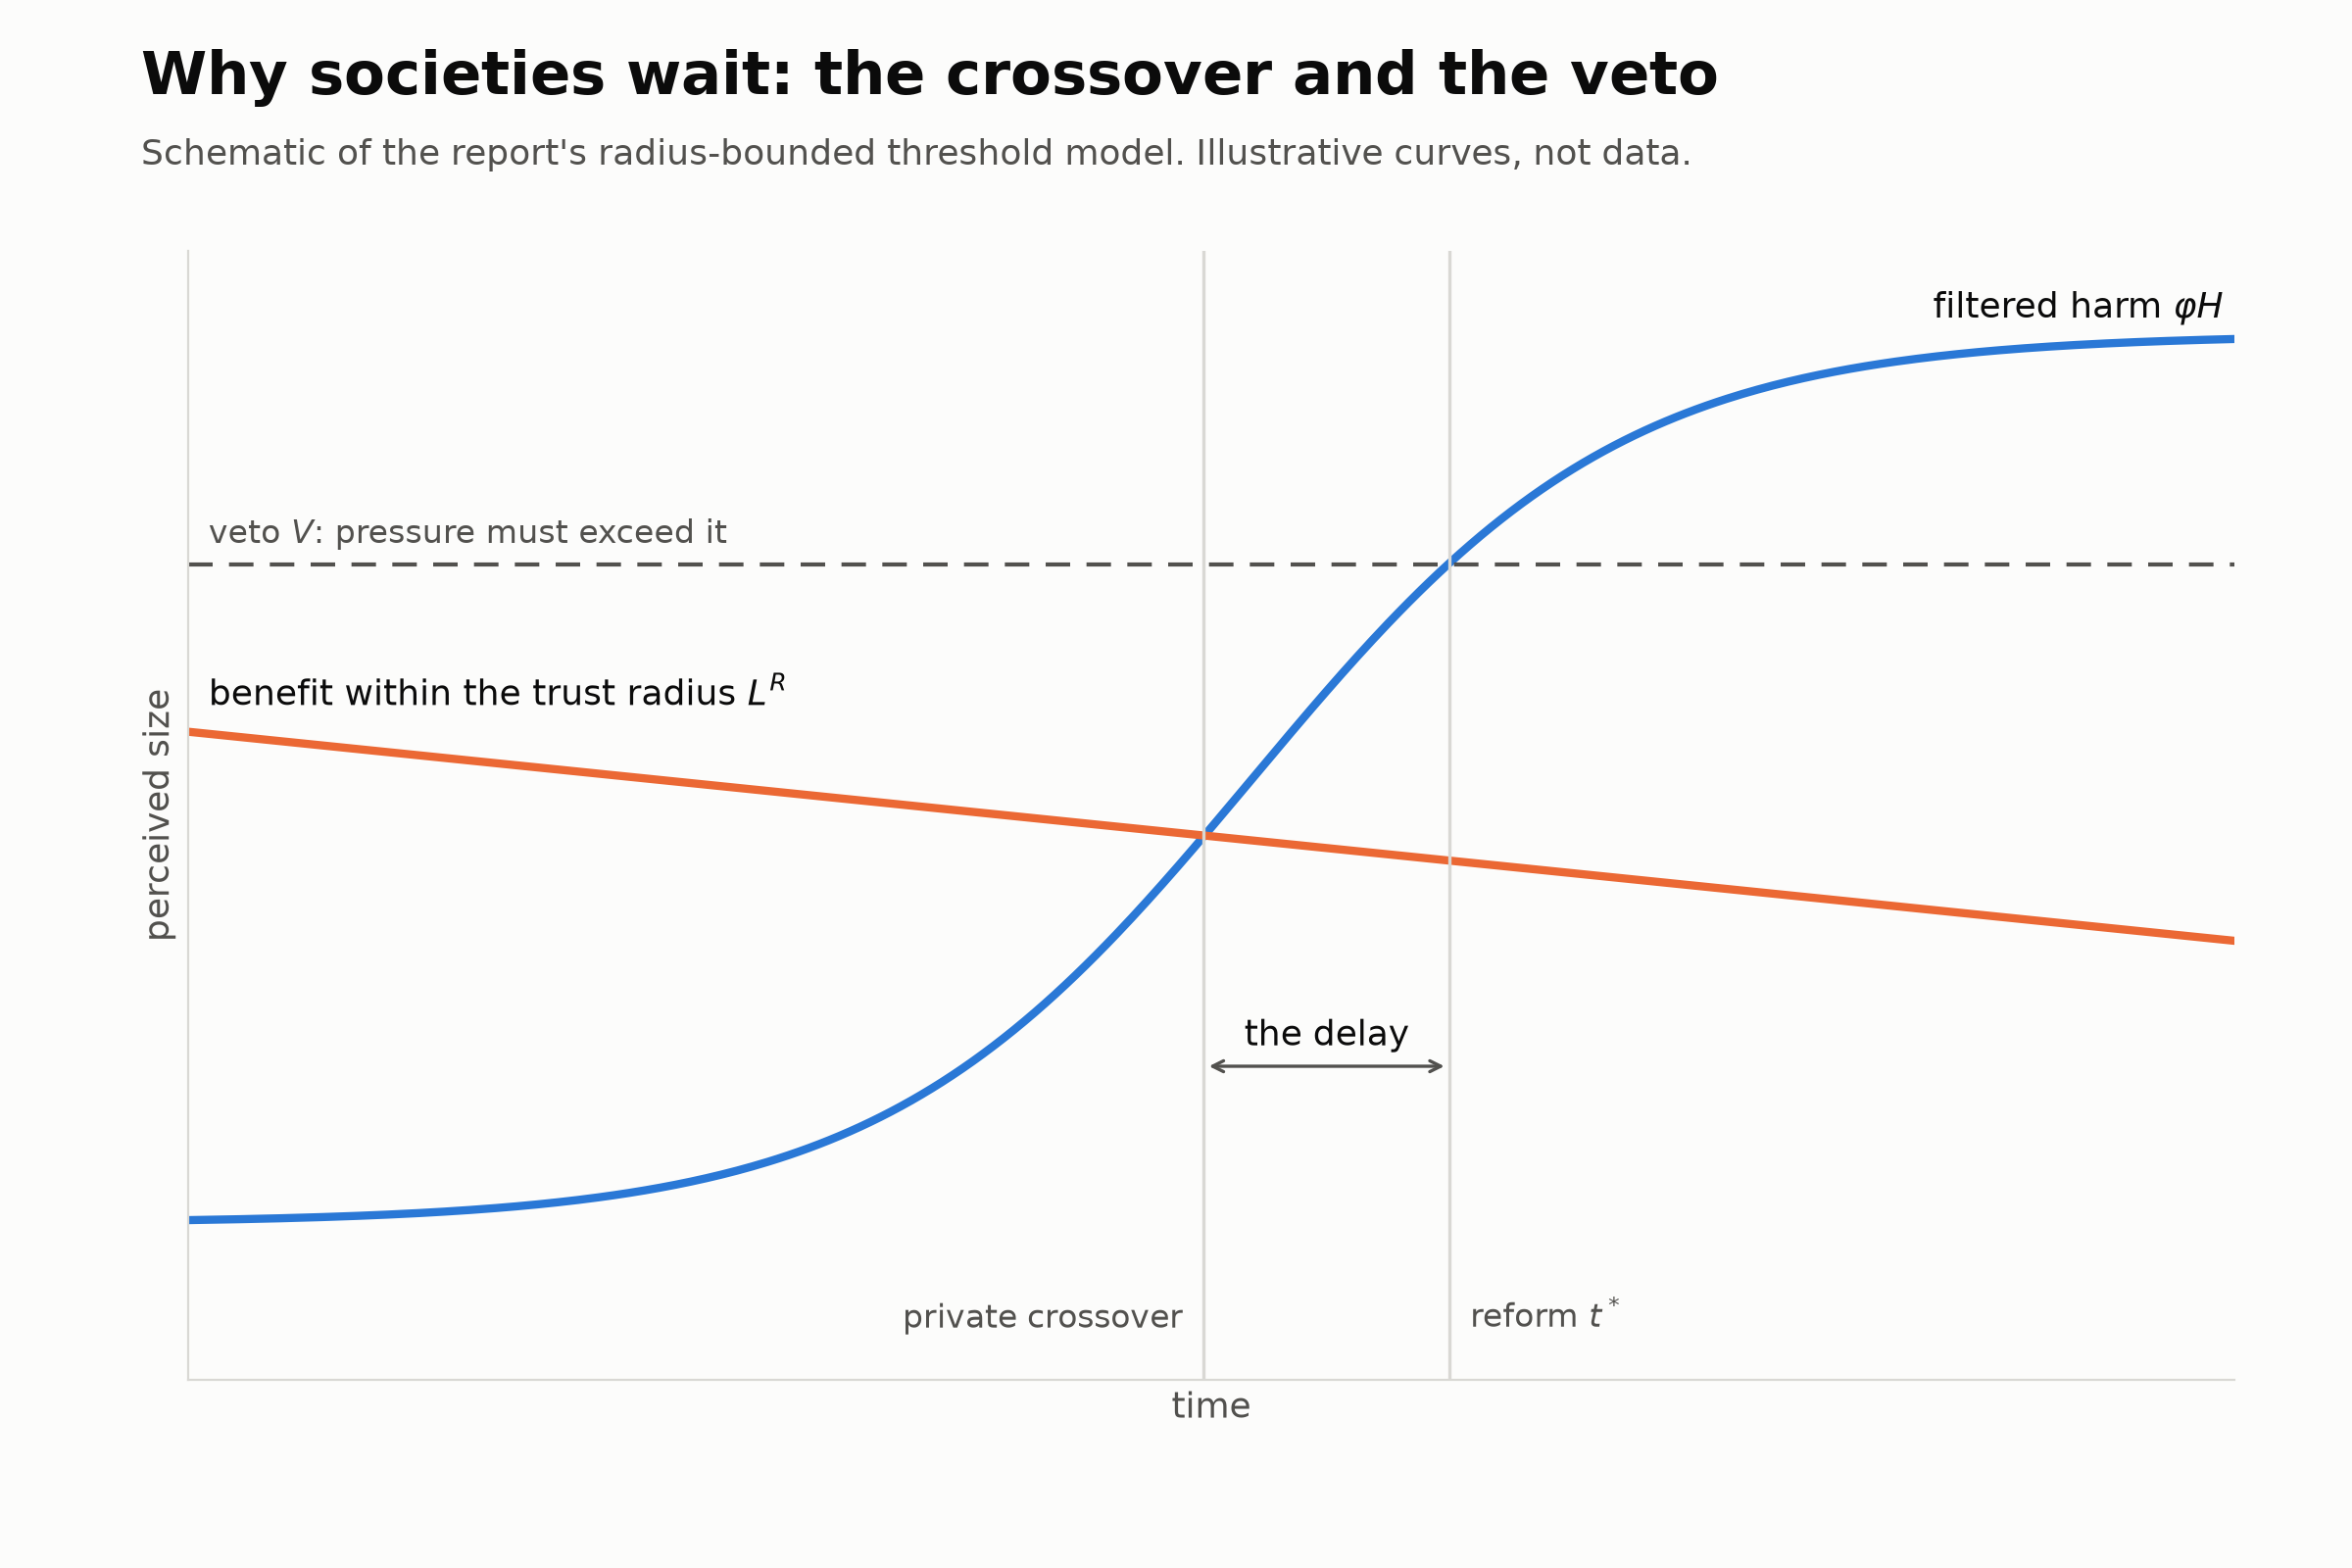
\[t^{*} = \min\big\{\, t \;:\; r(t) \ge r_c \;\;\wedge\;\; P\big(r(t)\big) > V(t) \,\big\}\]- \(r(t)\) is the share actually acting, and \(r_c\) is the critical fraction for a cascade.
- \(P\) is the political pressure the cascade generates.
- \(V(t)\) is the veto held by actors with large \(L^{R}\) and small \(\varphi H\).
- In the war-of-attrition reading, \(V(t)\) falls only as the cost of the status quo to the veto players rises (Alesina & Drazen, 1991; Drazen & Grilli, 1993; Drazen & Easterly, 2001). B.4.1 specifies which costs count. Diamond’s (2005) account of elite insulation points the same way, but I have it only from summaries.
Scaling:
\[r_c \perp N, \qquad n_c = r_c N, \qquad \mathbb{E}[T_{\text{tip}}] \sim \begin{cases} e^{\,cN} & p < p_c \ \ (\text{committed minority below critical})\\[2pt] \ln N & p > p_c \end{cases}\]The critical fraction is independent of population size \(N\), so the critical number grows in proportion to \(N\). The expected time to tip grows exponentially with \(N\) when the committed minority \(p\) is below its critical level \(p_c\), and only logarithmically above it (Granovetter, 1978; Xie et al., 2011; Centola et al., 2018). On networks, local structure matters more than \(N\) (Watts, 2002).
Reading the variables. \(V\), \(L^R\), the trust radius \(R\) and the institutional memory \(M\) (introduced in B.4.1) are punctualisations in Law’s (1992) sense: summaries of networks of associations that are continually performed and maintained, not structural forces given in advance. The formal model is a black-boxed description of network effects, and each variable’s value has to be traced case by case (see Part H).
The crossover intuition still contributes three things.
- The localised-benefit term still matters. It now works mainly through the veto players, whose \(L^{R}\) is large and whose \(\varphi H\) is small, and through the marginal actors near threshold. It does not work through the median citizen.
- The trust radius now enters three terms, which strengthens the original intuition. It sets the domain of \(L\). It partly sets the distance decay in \(\varphi\), because social distance compounds geographic distance. And it shapes the bias \(\delta\): the spiral-of-silence meta-analysis finds silencing strongest among family, friends and neighbours, r ≈ .34 against about .10 overall (Matthes et al., 2018). So a narrow trust radius both inflates the benefit that is defended and hides the support that would overturn it. That last step is my own synthesis and is untested.
- “Even if they see it coming” is explained without irrationality. Foresight raises \(H\), but \(\varphi\) and \(\delta\) keep it from becoming a felt crossover or a visible cascade, and \(V\) blocks the cascade that does form.
B.4.1 Extensions From Deep History and Cross-System Evidence
The historical cases and the comparison across systems support the core model and require four further elements.
1. The veto depends on elite exposure. The veto depends on harm inside the elite’s own radius, on the elite’s incumbent benefit, and on identity sorting, rather than standing as a fixed obstacle that crisis pressure must overcome:
\[V(t) = V_0 \;-\; \gamma\, H_{\text{elite}}(t) \;+\; \delta\, L^{R}_{\text{elite}}(t) \;+\; \sigma\, \Pi(t)\]When harm reaches the veto holders, or their incumbent benefit turns negative because cheap substitutes appear, \(V\) falls and can change sign. The elite then becomes the initiator, as with the Great Stink, the Dust Bowl, Tokugawa forestry, Venice and Montreal. \(\Pi\) is partisan or identity polarisation; when it is high, a crisis can raise \(V\) (Luca et al., 2020; Graham & Svolik, 2020). This element is my synthesis across the historical and cross-system findings, and the elite-exposure clause is a hypothesis, tested by P4.
2. Institutional memory resists shifting baselines.
\[\varphi_i = \varphi_0\, e^{-\lambda\,(t - t^{\text{base}}_i)} + M\]\(M\) is built by past disasters and maintained by standing institutions. It explains why recurrent hazards are routinely pre-empted and first-encounter hazards are not. It also predicts that \(M\) erodes as fiscal capacity falls, as the late-Qing granaries did. \(\varphi\) is also endogenous to \(V\) when incumbents control information, as with leaded petrol, tobacco and the “merchants of doubt” (Riris et al., 2024; Will & Wong, 1991; European Environment Agency [EEA], 2013; Oreskes & Conway, 2010).
3. An exit branch. Reform is not guaranteed to come eventually:
\[t^{*} = \min\big\{\, t : \big[r(t) \ge r_c \wedge P(r(t)) > V(t)\big] \;\vee\; V(t)\to 0 \text{ exogenously} \,\big\}\]The historical alternatives to reform driven by a cascade are elite displacement, collapse or exit, as when Angkor’s elites left first. Pressure can stay below \(V\) indefinitely (Hoyer et al., 2026; Penny et al., 2019).
4. Externality leakage. Pre-emption within a radius can export harm beyond it: Venice protected its lagoon at the mainland’s expense. So success within a radius need not improve welfare overall. This too is my synthesis from the historical cases.
Reconciling the crisis evidence. Drazen and Easterly (2001) find that crises are associated with modern macroeconomic reform only at extreme levels, such as hyperinflation or very high black-market premia. They do not show that reform requires an extreme crisis. CrisisDB, which covers pre-modern societies (Hoyer et al., 2026), and Nohrstedt et al. (2021), across 85 countries, both find reform uncorrelated with severity. The two results are compatible if the condition a crisis must meet is not severity as such. Hyperinflation and black-market premia fall directly on governing elites and their fiscal base; many disasters fall elsewhere. The model’s hypothesis is therefore that a crisis triggers reform when, and to the extent that, it enters the veto holders’ radius. This is my synthesis, untested as a general law; P4 tests it.
Scope. The model describes the dominant route to delay for commons and mass-behaviour problems, where harm is slow to arrive and diffuse, benefit is concentrated, and \(N\) is large. Where only a few people decide, as in regulatory capture or the incubation of failure inside an organisation, \(L^R\) plus \(V\) is enough and the cascade term \(\hat r\) does nothing. Where the bottleneck is detecting a signal inside an expert organisation, as before Pearl Harbor or 9/11, the model is the wrong tool.
Testable predictions and falsification tests are collected in Part F.
Part C: The Mathematics of Required Sentiment Change
C.1 Granovetter’s Threshold Cascade
Let \(F(x)\) be the cumulative distribution of thresholds, that is, the share of the population whose threshold is at most \(x\). Let \(r(t)\) be the share acting at time \(t\). Then
\[r(t+1) = F\big(r(t)\big)\]In Granovetter’s (1978, p. 1425) words, “it follows immediately that the process is described by the difference equation r(t+1) = F[r(t)]”. Several properties follow.
- Equilibrium. A fixed point satisfies \(r^* = F(r^*)\). Starting from \(r_0\), the process stops at the first point where \(F\) crosses the 45° line from above. A full cascade needs \(F(r) > r\) for every \(r \in [r_0, 1)\).
- Stability. A fixed point is stable if \(F'(r^*) < 1\).
- Fragility. With uniform thresholds \(\{0, 1, \dots, 99\}\) everyone joins. Replace the person with threshold 1 by a second person with threshold 2 and only one person acts (pp. 1424-1425), so near-identical populations can produce opposite outcomes. This is the formal version of the sandpile metaphor in my original essay.
- Fraction or count. Granovetter’s footnote 3 says “thresholds may usefully be described as either proportions or absolute numbers. The mathematical analysis is the same in either case.”
- Misperception. He explicitly models people who “systematically misperceive the proportion of others who have… joined” (p. 1437). Pluralistic ignorance enters the model here.
C.2 Does the Required Fraction Scale With Population Size?
I worked through nine cases.
Case 1: proportional thresholds (mean field). \(F\) is defined on fractions, so the critical fraction \(r_c\) (the smallest seed that leads to a full cascade) does not depend on \(N\). The absolute number needed, \(A_c = r_c N\), grows linearly with \(N\). This follows directly from the definitions in C.1.
Case 2: absolute thresholds. Suppose person \(i\) needs to see \(k_i\) others act. As a proportion, \(\theta_i = k_i / N\). For a fixed distribution of \(k\), every \(\theta_i \to 0\) as \(N\) grows, so cascades get easier in large populations and the required fraction falls roughly as \(1/N\). This becomes realistic once mass media make absolute crowd counts visible: Lohmann’s Leipzig turnout signals, or Chenoweth’s “11 million”. The derivation comes from Granovetter’s footnote 3. Whether people actually respond to absolute counts is an empirical question (see C.3).
Case 3: networks. In Watts’s (2002) model a node with degree \(k\) is vulnerable if its threshold satisfies \(\phi \le 1/k\), which happens with probability \(\rho_k = P(\phi \le 1/k)\). Global cascades are possible only if the cluster of vulnerable nodes percolates:
\[\sum_k k(k-1)\,\rho_k\, p_k \;>\; z, \qquad z = \langle k \rangle\]This summation is the standard way of writing his percolation condition. It depends on the degree distribution and the threshold distribution, and not on \(N\). More heterogeneous thresholds increase vulnerability; more heterogeneous degrees decrease it.
Case 4: committed minorities. In the binary-agreement naming game, a fraction \(p\) of agents never changes its opinion. In the mean-field case there is a critical \(p_c \approx 10\%\), and the time to consensus behaves as
\[T_c \sim e^{\alpha(p) N} \quad (p < p_c), \qquad T_c \sim \ln N \quad (p > p_c)\]The critical fraction does not depend on size, but below it the time a larger society takes to flip grows exponentially with its size (Xie et al., 2011). I consider this the most important scaling result for my argument. A large society can stay stuck for an effectively unbounded time just below critical mass, then flip quickly once it crosses.
Case 5: experimental conventions. In Centola et al. (2018), a committed minority of about 25% tipped the group convention. The largest minority that failed was 21% and the smallest that succeeded was 25%, with about 72% uptake above the threshold. The predicted critical mass rises with agents’ memory length \(M\) and stays below 50%. The authors say 25% is “not expected to be a universal value”. Groups in the experiment were small, roughly 20-30 people each, though I could not confirm the exact numbers.
Case 6: Olson, and why his result is not a general law. Olson’s (1965) free-rider logic, simplified, says \(i\) contributes if and only if
\[F_i V_g(T) - C(T) > 0\]where \(F_i\) is \(i\)’s share of the group’s gain. If \(F_i \approx 1/N\) and the cost of the good grows with \(N\) (zero jointness of supply), contributions fail as groups grow. Two findings show that the blanket claim, that larger groups are less able to act collectively, is false as a general law.
- Oliver and Marwell (1988) show that the sign depends on costs. If the cost of the collective good varies little with group size, “larger groups should exhibit more collective action”, because they are more likely to contain a critical mass of highly interested, well-resourced actors. The effect is stronger with heterogeneity and non-random social ties.
- In voluntary-contribution experiments with groups of 4, 10, 40 and 100, “groups of 40 and 100 provided the public good more efficiently than groups of 4 and 10” (Isaac et al., 1994).
Case 7: the volunteer’s dilemma (diffusion of responsibility). With \(m+1\) players and normalised cost \(c < 1\), the symmetric mixed equilibrium is
\[p^* = 1 - c^{1/m}, \qquad P(\text{provided}) = 1 - c^{(m+1)/m} \;\to\; 1 - c \ \text{ as } m \to \infty\]Each person’s effort falls with group size, and the chance that nobody acts rises towards \(c\) (Diekmann, 1985, as restated by Konrad, 2025). Laboratory evidence, including a large-N Tinbergen experiment, does not show a clean monotonic effect.
Case 8: the 3.5% rule. Chenoweth and Stephan (2011) found that no government withstood a campaign whose peak event mobilised 3.5% of the population. Chenoweth’s own caveats (Chenoweth, 2020a) are substantial:
- the rule is “descriptive… not necessarily prescriptive”;
- it applies only to maximalist campaigns, those aiming to overthrow a government or win independence;
- only 17 of 169 nonviolent campaigns (10%) reached 3.5%;
- “among all maximalist nonviolent campaigns that did succeed, 83% did so without crossing the 3.5% threshold”;
- Bahrain (2011-14) failed with over 6% participation;
- “it’s a rule, not a law”;
- on whether it applies to climate or other reformist campaigns: “No one knows.”
She also notes that 3.5% “is a large absolute number… In the U.S. today, 3.5% would be well over 11 million”. The 2017 Women’s March drew 1-1.6%. So she treats the threshold as a fraction while recognising the logistics of the absolute number. The success rate of nonviolent revolutions fell from about 65% in the 1990s to below 34% since 2010 (Chenoweth, 2020b). Treating 3.5% as a law, or as a sufficient condition, is wrong by Chenoweth’s own account.
Case 9: social tipping in climate. Otto et al. (2020) identify six social tipping elements: energy, settlements, financial markets, norms, education, and information feedbacks. Milkoreit (2023) finds the concept widely overused, with premature labelling, missing system boundaries, and no evidence of feedbacks or multistability. Whether these interventions will stabilise the climate by 2050 is unproven, and critics dispute it (Smith et al., 2020; Milkoreit, 2023).
What this means for scaling.
- In all the standard proportional models (Granovetter, committed minorities in the naming game, Centola), the critical fraction does not depend on population size, so the absolute number needed grows roughly linearly with \(N\) (Granovetter, 1978; Xie et al., 2011; Centola et al., 2018).
- The time to reach consensus does depend on \(N\): exponentially below the critical fraction and logarithmically above it. Large populations just short of critical mass can stay stuck indefinitely (Xie et al., 2011).
- On networks, structure (degree, clustering, heterogeneity of thresholds) matters more than \(N\) (Watts, 2002).
- If people react to absolute counts, the required fraction falls as \(N\) grows. Olson-type cost scaling makes it rise. Which effect wins is an empirical matter (Granovetter, 1978; Oliver & Marwell, 1988).
- There is no universal tipping fraction for real societies. The candidates are about 10% (Xie, theoretical), about 25% (Centola, experimental, dependent on memory) and 3.5% (Chenoweth, descriptive, peak participation, maximalist campaigns only). They measure different things and cannot be compared directly. Centola et al. (2018) say their figure is not universal, Chenoweth (2020a) calls hers “a rule, not a law”, and the Bahrain case failed above it.
C.3 Pluralistic Ignorance, the Spiral of Silence and Preference Falsification: The “Iceberg”
| Finding | Source |
|---|---|
| “Large-scale participation is usually the tip of the iceberg, and there is usually much broader public support for the movement than the people who are active in the streets… there is no way to calculate how much popular support is needed… without comprehensive opinion polling.” Organising only for turnout benchmarks “may create a loud but wildly unpopular minority”. | Chenoweth (2020a, p. 3) |
| In the USA (N = 6,119): “While 66-80% Americans support these policies, Americans estimate the prevalence to only be between 37-43% on average.” Between 80% and 90% of people underestimate support. The authors call this a “false social reality”. | Sparkman et al. (2022) |
| Across 125 countries and about 130,000 people, 69% are willing to contribute 1% of their income, 86% endorse pro-climate norms and 89% demand more political action. People “systematically underestimate” others’ willingness, and because cooperation is conditional, the misperception suppresses action. | Andre et al. (2024) |
| The global perception gap is 26 percentage points: 69% actually willing against 43% perceived. | Andre et al. (2024) |
| A complication. In five preregistered experiments (N = 5,081), people overestimated rare behaviours (others donating and engaging politically) while underestimating broad support. Correcting the misperceptions changed stated willingness to donate but not actual donations. | Tiede et al. (2026) |
| Hidden private opposition combined with threshold-based public expression produces sudden, unpredictable cascades. 1989 is the paradigm case. | Kuran (1991) |
| Each turnout reveals hidden private information about the regime. Cascades end once their informational role is exhausted (Leipzig, 42 Monday demonstrations). | Lohmann (1994) |
| Spiral-of-silence effects are small on average (r ≈ .05-.10). The largest effect (r ≈ .34) is within family, friends and neighbours. | Glynn et al. (1997); Matthes et al. (2018) |
A worked iceberg model. Let \(N\) be the population, \(s\) the share of latent sympathisers (people who privately prefer change) and \(a\) the share actively taking part. Define the iceberg ratio as
\[I = \frac{s}{a}\]Among sympathisers, let \(G(\cdot)\) be the cumulative distribution of participation thresholds over perceived participation \(\hat a\). Participation then follows Granovetter’s dynamics, restricted to the iceberg:
\[a(t+1) = s \cdot G\big(\hat a(t)\big), \qquad \hat a(t) = \lambda\, a(t)\]Here \(\lambda < 1\) is the discount from pluralistic ignorance (people underestimate participation). At a fixed point, \(a^* = s\,G(\lambda a^*)\), so
\[I^* = \frac{s}{a^*} = \frac{1}{G(\lambda a^*)}\]The iceberg ratio is the reciprocal of the share of sympathisers whose threshold has been met. A cascade from a seed \(a_0\) requires \(s\,G(\lambda a) > a\) for all \(a \in [a_0, s)\). That gives three levers, each tied to a literature:
- raise \(s\), through persuasion or experienced harm (Weber, 2006; Hazlett & Mildenberger, 2020);
- raise \(\lambda\) towards 1 by correcting misperception (Sparkman et al., 2022; Andre et al., 2024), which Tiede et al. (2026) show is not always enough;
- shift \(G\) to the left by lowering costs or making absolute counts more salient (Chenoweth, 2020a; Lohmann, 1994).
Illustrative numbers. These are assumptions, not estimates.1 Take \(s = 0.69\) from Andre et al. (2024), and take \(\lambda \approx 0.62\), implied by perceived support of about 0.43 against actual support of 0.69 and applied to the support signal. Then:
- a peak at Chenoweth’s scale, \(a = 0.035\), implies \(I \approx 20\);
- a peak at the scale of the Women’s March, \(a \approx 0.013\), implies \(I \approx 53\);
- Chenoweth’s own heuristic, 3.5% active with probable majority support, gives \(I \gtrsim 14\).
My intuition that visible protesters are one or two orders of magnitude fewer than the latent sympathetic population is therefore consistent with the data. The difficulty is that \(G\) for costly action is heavily right-skewed, so a large \(s\) does not automatically produce a large \(a\) (Tiede et al., 2026).
Part D: Is the Montreal Protocol the Exception?
The terms below come from the model in Part B: \(H\) is harm, \(L^R\) is the benefit of the status quo within an actor’s trust radius, \(\varphi\) filters how much of the harm is perceived, \(\hat r\) is the perceived share of others acting, and \(V\) is the elite veto.
D.1 Montreal
The Montreal Protocol was pre-emptive in one sense: no significant mid-latitude ozone loss had been measured when it was signed. But the ozone hole and NASA’s images of it did help bring it about: negotiators formally set the hole aside, yet the images still shaped the actors (Grevsmühl & Briday, 2023). The 1987 terms were also weak (a 50% cut), and the phase-out came only in 1990-92.
It succeeded because every variable was favourable:
- there were few producers, so the veto was small;
- DuPont expected to profit from substitutes, so the incumbent’s \(L^R\) changed sign;
- the US gained even acting alone, so \(H\) fell inside the veto holder’s radius;
- trade sanctions on non-parties corrected \(\hat r\) and removed free-riding.
D.2 Deep History
I examined about 25 pre-modern cases, from the Bronze Age to the Little Ice Age. The record splits sharply.
Recurrent, local, visible hazards on bounded commons were often handled by long-lived anticipatory institutions, usually founded after a first disaster. Examples include the Dutch and Flemish water boards, Ragusa’s 1377 quarantine, the Törbel alp statutes, Japanese iriai forests, the Valencian huertas, the Qing ever-normal granaries and Tokugawa forestry.
Novel, diffuse, slow threats whose costs fell outside the deciders’ circle were usually met late, reactively or under elite obstruction. Examples include the Gracchan land crisis, England’s labour statutes after 1349, Mamluk Egypt, late Flemish flood defence and 17th-century Italian plague.
Revisionist work on collapse removes several canonical cases of societies that “chose to fail”. The Norse in Greenland adapted (Dugmore et al., 2012), Rapa Nui had no demographic collapse before European contact (Moreno-Mayar et al., 2024), and Angkor declined gradually (Penny et al., 2019).
D.3 The Base Rate
No study measures the base rate of pre-emptive action directly. CrisisDB (168 crises) shows that only about 31% saw any reform that improved welfare, and reform was uncorrelated with the severity of the crisis (Hoyer et al., 2026). My own judgement, which is an estimate and not a measurement, is that about 5-25% of responses are pre-emptive for novel slow threats where incumbents hold concentrated benefits.
D.4 What Distinguishes the Pre-Emptive Successes
Mapped to the model’s variables, the successes share these features:
- The trust radius coincides with the commons, so \(L^R\) and \(H\) are summed over the same people (Ostrom’s design principles 1 and 3).
- Harm falls inside the veto holders’ own radius, or their \(L^R\) turns positive.
- There are few decision-makers, or the polity is small.
- Mutual monitoring corrects \(\hat r\).
- Recurrence plus institutional memory keeps \(\varphi\) high.
- Cheap substitutes exist.
- The state has capacity and is fiscally healthy.
- The harm is visible and can be pictured.
Montreal is the exception for novel, global threats, and deep history explains why. Pre-emption happens when veto holders are inside the radius of harm, when those who pay are those who decide, and when the memory of past disaster is built into institutions. Climate change and AI risk currently meet none of these three conditions. That is what the radius-bounded mechanism predicts, and the historical record broadly confirms it.
Part E: Does the Mechanism Generalise Across Systems?
Yes, within limits. The mechanism describes a plurality, and probably a majority, of documented cases where harm is slow to arrive, diffuse or delayed and the benefits are concentrated. That class includes chemical and occupational hazards, fisheries and land commons, financial booms, pensions and demographics, infrastructure maintenance, antimicrobial resistance, and parts of democratic erosion. It does not describe most systems with routine, acute, attributable feedback, such as aviation safety, food recalls and acute drug toxicity. Those systems succeed without fuss and leave no case record.
E.1 A Catalogue of 33 Cases
I coded 33 cases across 10 domains. This is a convenience sample, biased towards famous failures, and both the outcome categories and the fit ratings are my own analytical judgements.
- Outcomes: 21% prompt or pre-emptive, 33% late, 30% where prevention failed and 15% ongoing with no adequate action. In all, 79% were late, failed or ongoing.
- Fit of the full four-term mechanism: strong in 33%, partial in 39%, and weak (or another mechanism dominant) in 27%.
E.2 Population-Scale Evidence Not Selected on Outcome
Three bodies of evidence avoid the selection problem.
- Public budgets in every Comparative Agendas Project dataset are leptokurtic: long delay, then a lurch (Jones et al., 2009).
- Financial crises are frequent (164 since 1970) and predictable, yet they are not prevented (Laeven & Valencia, 2020, 2026; Greenwood et al., 2022).
- Across 85 countries and 10,976 events, disaster severity does not predict reform of disaster policy (Nohrstedt et al., 2021).
E.3 Where Delay Collapses
The boundary conditions, mapped to the model’s variables:
- Harm is immediate and attributable (\(\varphi \to 1\)). Thalidomide was withdrawn within about 10 days.
- Harm enters the veto holders’ radius, so \(V\) falls. Examples are the Great Stink and dust reaching Washington.
- Substitutes are cheap (\(L^R\) small).
- Decision-makers are few and monitor each other (\(\hat r\) accurate).
- A free press and electoral accountability raise \(\varphi\) and lower \(V\) (Besley & Burgess, 2002). This holds only as a tendency. Sen’s claim that democracies with a free press do not have famines fails as an absolute law: Malawi in 2002 and Niger in 2005 are counterexamples (Rubin, 2008, 2009).
E.4 Existing General Theories of Delay
Several theories already explain delay across domains:
- Platt’s (1973) social traps, at the micro level;
- Kuran’s (1995) preference falsification, also micro, which corresponds to the \(\hat r\) term;
- institutional friction and punctuated equilibrium, at the meso level and quantitatively validated (Jones et al., 2009);
- path dependence and carbon lock-in (Pierson, 2000; Unruh, 2000);
- Geels’s (2014) regime resistance;
- the Collingridge (1980) dilemma;
- disaster incubation;
- predictable surprises (Bazerman & Watkins, 2004);
- the ostrich paradox;
- evolutionary traps in the Anthropocene (Søgaard Jørgensen et al., 2024).
As far as I can find, none of them combines the cascade threshold, a biased \(\hat r\), a radius-bounded \(L\), an endogenous elite veto and scaling with \(N\) (see The Short Version).
Part F: Testable Predictions and Falsification Tests
The model explains prompt cases by parameter values: high \(\varphi\), low \(L^R\), low \(V\). That makes it unfalsifiable unless the parameters are coded before the outcomes are known, so every test below is framed that way. None of these tests has been run yet; they are proposals.
P1: Ex-ante lag ranking. Code \(\varphi\) (latency, visibility, attributability), the concentration of \(L^R\), \(V\) (veto points, incumbents’ share of lobbying) and the bias in \(\hat r\) for a pre-registered set of current hazards. These codings predict the rank order of response lags.
- Tests: the whole model.
- Falsified by: a rank correlation near zero.
- Data and design: a pre-registered panel of live hazards, such as PFAS, antimicrobial resistance (AMR), microplastics and AI incidents.
P2: Trust radius predicts speed. Societies with a wider trust radius act sooner after equivalent warnings or shocks (see Part B).
- Tests: the radius of \(L^R\).
- Falsified by: no relationship.
- Data and design: the trust-radius scores of Delhey et al. (2011) against adoption lags for the same EU directive or WHO guideline.
P3: Correcting misperceived support works only where the barrier is social, the step is cheap and the target is below the true norm. Publicising true private support (who thinks the behaviour should happen) raises actual behaviour more than equally vivid harm information when three conditions hold: the behaviour is low-cost or a first step, others’ disapproval is what holds it back, and the target underestimates support. This applies in climate and beyond it (AMR prescribing, pension enrolment, coordinated platform use). For costly or rare behaviours the effect on actual behaviour is near zero. The effect reverses for targets already doing better than the norm, and for targets shown a lower local norm or a lower prevalence than they believed. Information about how common rare costly acts are lowers \(\hat r\), because people overestimate that prevalence (see Parts B and C).
- Tests: \(\beta(\hat r_i)\), where the sign of \(\delta_i\) depends on what is being estimated: \(\delta > 0\) for broad support and \(\delta < 0\) for the share performing rare costly acts. The effect is moderated by the cost threshold \(\kappa_i\) and by the target’s prior relative to \(r\).
- Falsified by: (a) support information doing no better than harm information on actual behaviour for cheap, socially sanctioned behaviours; (b) equal effects for cheap and costly behaviours; or (c) no reversal among above-norm targets, or in reference groups with low support, when no injunctive cue is given.
- Data and design: a preregistered factorial field experiment crossing information type (support, harm, both, control) with behaviour cost (cheap, costly) and the respondent’s prior relative to the truth. Run it in at least two domains outside climate, using the designs of Hallsworth et al. (2016), Beshears et al. (2015) and Bursztyn et al. (2025). The outcome is actual behaviour. Pool the results in a meta-analysis that corrects for publication bias.
P4: Elite exposure beats severity. Reform clusters when harm enters the veto holders’ radius (disasters in capitals, in legislators’ constituencies or in their families), and not with severity as such (see Part B).
- Tests: \(V(H_{\text{elite}})\).
- Falsified by: events that expose elites producing no more reform than equally severe events that do not.
- Data and design: extend Nohrstedt et al. (2021) and CrisisDB with a coding of elite exposure.
P5: Larger polities lag longer. Controlling for veto points, larger polities with similar committed minorities sit longer just below the tipping point (see Part B).
- Tests: the scaling of time to tip, \(T_{\text{tip}}\), with \(N\) (Xie et al., 2011). CrisisDB already shows a scale effect.
- Falsified by: no effect of size, or large polities acting faster.
- Data and design: cross-national adoption lags. The confound is that population size covaries with federalism and with the number of veto points.
P6: The asymmetry between benefit and harm predicts lurching. Policy topics with diffuse harm and concentrated benefit show higher budget kurtosis than topics with concentrated harm.
- Tests: the \(L^R / H\) asymmetry acting through institutional friction.
- Falsified by: no difference, or the reverse.
- Data and design: Comparative Agendas Project budget series by topic.
P7: Action lands at the deadline. Across hazards with a publicly known, dated deadline (a trust fund running out, an agreement expiring, a statutory sunset, a debt-limit X-date, a treaty step), comprehensive action arrives near the deadline. The distribution of lead times (the deadline minus the date of comprehensive action) is skewed towards zero. The clustering grows with the number of veto points and with the size of the incumbents’ \(L^R\) from the status quo.
- Tests: \(V\) as a war of attrition with a known deadline. Generic “deadline effect” models predict clustering at any known end date, whoever holds the vetoes. This model predicts that the clustering rises with the number of vetoes and with \(L^R\), and that interaction is what sets it apart. A deadline also makes the date of harm public, which acts on \(\varphi\) (the temporal distance becomes known) and on \(\hat r\) (the date is common knowledge).
- Falsified by: lead times that are uniform or skewed early, or lead times unrelated to the \(V\) and \(L^R\) scores (a generic deadline effect without the model’s interaction).
- Data and design: a pre-registered panel, with \(V\) and \(L^R\) scored before outcomes are known and blind to lead time for cases already resolved. Open cases: US OASI (Q4 2032), US Medicare HI (Q2 2033), and the Kigali HFC steps for non-Article 5 countries (85% by 2036). Resolved cases: the 1983 Social Security amendments; the US debt-limit episodes of 2011, 2013, 2023 and 2025; the individual provisions of the TCJA (end of 2025); Colorado River operations (from 1 October 2026); and Korea’s National Pension (2055 projection).
P8: Crises polarise under identity sorting. In domains sorted by party (guns, democracy, US climate policy), crises increase divergence in enacted policy instead of producing convergence (see Part B).
- Tests: \(\sigma\Pi\) in \(V\), and partisan \(\varphi\).
- Falsified by: crises producing convergence across parties in sorted domains.
- Data and design: panels of state-level enacted laws, following the design of Luca et al. (2020).
P9: Institutional memory protects against shifting baselines. Recurrent hazards with standing institutions are pre-empted more often than hazards of similar severity met for the first time. Institutional capacity (\(M\)) erodes as fiscal capacity falls.
- Tests: \(M\) within \(\varphi\).
- Falsified by: recurrence and standing institutions showing no advantage.
- Data and design: CrisisDB and Seshat; panels of disaster history; the design of Riris et al. (2024).
P10: An aligned radius means enduring commons. Commons where users, beneficiaries and rule-makers are the same people outlast those whose boundaries are breached from outside or whose rules are made by outsiders. They also decay when decision-making is captured by actors outside the exposed population.
- Tests: the alignment of the radii of \(L^R\) and \(H\).
- Falsified by: boundary alignment not predicting durability.
- Data and design: an extension of the Ostrom-based meta-analysis of Cox et al. (2010), and a panel of water boards following van Bavel et al. (2018).
P11: Incumbents suppress information. Where incumbents control the research on a hazard, the lag from warning to action is longer than for comparable hazards studied independently.
- Tests: \(\varphi\) as endogenous to \(V\).
- Falsified by: no difference in lag.
- Data and design: the cases in the European Environment Agency’s Late lessons from early warnings (2001, 2013), coded by who funded the early research.
P12: Pre-emption exports harm. Pre-emptive successes within a radius show measurable displacement of harm onto populations outside it.
- Tests: leakage of externalities.
- Falsified by: no displacement in matched cases.
- Data and design: paired historical and modern cases (Venice and its mainland; the offshoring of emissions).
P7 in combination. Paired with P9 (recurrent against first-encounter hazards), P7 gives a 2×2 design: known or novel hazard, with or without a deadline. It separates “waits for the deadline” from “cannot perceive the threat”. The first predicts late action on known hazards with deadlines; the second predicts late action on novel hazards whatever the deadline. Within the panel, P20 (Part G) predicts that cases with more distinct beneficiary groups or statutes land closer to their deadlines.
Predictions P13-P21, on downstream harms and accreted wickedness, are in Part G in the same format. Predictions P22-P24, on causal AI, attribution and the atrophy of tracing, are in Part H.
Applied to the three systems in the research question. These forward predictions are untested.
- Credit. P4 predicts reform when debt-service costs hit the fiscal base of governing coalitions, and not when household distress peaks. P7 predicts that where fiscal hazards carry dated deadlines (debt-limit X-dates, trust funds running out, tax sunsets), resolution lands close to them, and closer still where the budget process has more veto points.
- Climate. P3, P4 and P9 predict faster action where misperceived support is publicly corrected (for cheap, socially sanctioned steps), where elites are directly exposed, and where adaptation institutions persist between disasters.
- AI safety. The Collingridge dilemma, P1 and P11 predict delay until harms can be attributed and fall on veto holders. Safety research funded by incumbents would lengthen the lag.
Part G: N-Order Harms and Accreted Wickedness
Parts B to F treat a harm as if it fell directly on the people who perceive it and on the elites who veto action against it. Most harms do not work that way. An unresolved root cause sends harm down a causal chain into other domains. French deficits spill into social budgets and euro-area spreads. Warming and fuel build-up lead to utility bankruptcy and insurers pulling out. An unstudied product affects adolescent health, and a food environment drives metabolic disease. To see how this changes the model, I coded four current chains and three resolved historical ones (lead, tobacco and CFCs), and checked the literature on unintended consequences, policy feedback, layering, programme termination and wicked problems.
G.1 Downstream Harm Changes the Model
1. Attribution decays along the chain. Let \(a_j \in (0, 1]\) be the attributability of link \(j\): how clearly the people who bear that link’s harm trace it back to its cause. Seen from link \(k\), the perception filter for the root’s harm is then roughly
\[\varphi_k \;\approx\; \varphi_0 \prod_{j=1}^{k} a_j \;+\; M ,\]where \(M\) is the institutional-memory term from Part B. One contested link is enough to drive the product toward zero. The link from social media to body image is an example: the association is about \(r \approx .16\), and whether it is causal is disputed. Lead and crime is another, where the literature shows publication bias and the best studies find effects near zero.
2. The people who bear downstream costs hold no veto where the harm starts. Homeowners in fire zones have no vote on global emissions. Adolescents have no say over platform design. Future French taxpayers and euro-area partners have no seat in the coalitions that defend current commitments. In the terms of Part B, harm \(H\) is large where the veto \(V\) is absent, and \(V\) is large where \(H\) is small.
3. Responses settle at the nearest attributable link with the lowest veto. Write \(V_k\) for the veto against action at link \(k\) and \(\theta\) for the attribution needed before anyone acts. Then
\[k^{*} \;=\; \arg\min_{k}\,\big\{\, V_k \;:\; \varphi_k H_k \ge \theta \,\big\}, \qquad V_{k^{*}} \ll V_{\text{root}} .\]In all four current chains, most enacted policy sits downstream. In California it takes the form of utility liability funds (AB 1054, SB 254), insurer rules and the FAIR Plan. For social media it is age limits, phone bans and design codes. Obesity gets GLP-1 coverage alongside narrow food rules. France has had government collapses and market repricing in place of deficit correction. Each chain also has some action at the root (cap-and-invest to 2045, the soft drinks levy, the EU deficit procedure), but it is slower and smaller. Four cases chosen this way show a pattern, not a rate.
4. Symptomatic relief lowers pressure on the root cause. This is Senge’s “shifting the burden” applied to policy: relief \(R_k\) at link \(k\) reduces the harm that reaches the root, so the root harm actually felt is \(H_{\text{root}} - R_k\). I know Senge’s idea only through secondary summaries. Commentators worry that GLP-1 drugs will weaken pressure for food regulation, but nobody has yet shown that this crowding-out happens.
5. Carriers bring the harm inside the veto radius. A carrier is an actor who moves a downstream cost onto the people who hold the veto at the root. In the veto equation from Part B,
\[V = V_0 - \gamma H_{\text{elite}} + \delta L^{R}_{\text{elite}} + \sigma\Pi ,\]a carrier raises \(H_{\text{elite}}\). The chains turned up four kinds:
- Creditors and bond markets. France’s rating cuts in 2024 and 2025 (per the AFT ratings record) and spreads at their widest since 2012 hit the governing coalition’s fiscal base. The spread figures come from market press, not from an official series.
- Insurers. State Farm and Allstate withdrew, and the FAIR Plan made its first assessment since 1994, which put fire risk onto property owners and the state (California Department of Insurance orders).
- Courts and state treasuries. Medicaid cost-recovery suits turned smokers’ illness into a claim on state budgets, settled in the 1998 Master Settlement Agreement (General Accounting Office, 2001).
- Partner states and foreign regulators. The EU opened a deficit procedure for France (Council of the European Union, 2024), and EU, UK and Australian platform rules now reach US firms.
In the three resolved historical chains, action at the root followed the arrival of a carrier, not a peak in downstream harm. This fits the claim in Part B that reform follows harm entering the veto holders’ radius. It has not been tested on unselected data (P16). Points 2, 3 and 5 are my own synthesis, built on the facts above.
Precedent: traceability. The closest precedent for points 1 and 3 is The Logic of Congressional Action (Arnold, 1990). Arnold argued that the “nature of the causal chain that links a policy instrument with its policy effects” shapes what Congress does: citizens can hold a legislator to account for an effect only if they can trace it to a government action, and from there to their own representative (quoted in Mildenberger & Sahn, 2025). On his account, early effects are easier to trace than later ones, and coalition leaders break traceable links on purpose, for example by folding costly provisions into omnibus bills. I have this second part from course summaries; I did not open the book.
In this report’s terms, Arnold’s traceability is the product \(\prod a_j\), and his legislators, who choose instruments whose effects voters can or cannot trace, are the actors who settle at \(k^*\). My model differs from his in two ways. First, his chain runs from one policy to its effects. The chains here run from a root that nobody has addressed, through several domains, so the product has more terms and the root is an omission rather than an act. Second, the first direct test of Arnold’s claim found that legislators respond to policy and problem traceability, while prospective voters are indifferent to it (Mildenberger & Sahn, 2025). Attribution decay may therefore bind mainly through elites anticipating blame, rather than through what the mass public concludes.
Experiments on moral judgement add two qualifications. Blame for an agent weakens as the chain between the act and the harm gets longer, because the harm looks less foreseeable (Engelmann & Waldmann, 2022). And the loss concentrates at intervening agents. People trace responsibility back through physical links to a human cause, but a voluntary actor in the middle of the chain absorbs it (Hilton et al., 2010). So \(a_j\) is low at insurers, utilities and local officials, and high at physical links such as warming to fire weather. Veto holders can add agentive links deliberately, through blame avoidance by delegation (Hood, 2011) or Arnold’s link-breaking. Part of the decay is then produced by the veto holders themselves, which ties point 1 back to \(V\). That last step is my synthesis.
G.2 Accreted Wickedness
The core claim below is my own synthesis, with the corrections from my literature check built in.
Unresolved root causes produce n-order harms that are hard to trace. Policy responds at the symptom. Each response creates its own beneficiaries (policy feedback; Pierson, 1993), and they join the veto. Each layer is deliberate, but the aggregate is not (Kahn’s “tyranny of small decisions”; Kahn, 1966). Taken together, the layers turn a tractable problem into a wicked one, so the wickedness is made rather than found. The result is extremely difficult to unwind. Resolution mostly comes through crisis, which links back to Part B: the crisis has to reach the radius of many dispersed veto groups at once. Failing that, it comes through elites being displaced, or through exit. Bundled loss-sharing bargains (the 1986 tax reform) and reform led by ideas (airline deregulation) are rarer routes that need no crisis, and their gains can erode.
In model terms, each symptomatic layer \(\ell\) adds a beneficiary group \(b_\ell\) to the veto against reform at the root:
\[V_{\text{root}}(n) \;=\; V_0 \;+\; \sum_{\ell=1}^{n} \delta_\ell\, L^{R}_{b_\ell} \;-\; \gamma\, H_{\text{elite}} \;+\; \sigma\Pi .\]A bargain that compensates every group has to clear \(n\) separate vetoes, so the space for a bargain shrinks as \(n\) grows.
What the evidence supports, and the corrections.
- The components are established. The literature covers unintended aggregate consequences (Merton, 1936; Kahn, 1966), policy creating its own constituencies (Pierson, 1993), layering (Streeck & Thelen, 2005), and layered policy mixes that are incoherent and hard to change (Rayner & Howlett, 2009). It also documents policy accumulating faster than it is removed (Adam et al., 2019), policy responding to its own consequences (Wildavsky, 1979), iatrogenic regulation (Wiener, 2003) and maladaptation (Barnett & O’Neill, 2010). The IPCC states that “some responses to climate change result in new impacts and risks”.
- “Made, not found” runs against Rittel and Webber, who treat social planning problems as inherently wicked. Head and Alford (2015) treat wickedness as a matter of degree. The precedent for wickedness being constructed is Daviter (2019), for whom it is an interpretive framing. Peters (2017) is not a precedent for this: he argues only that the label is over-applied. Accreted wickedness differs from Daviter’s view too, because here policy layers produce the wickedness causally, rather than framing producing it.
- Novelty. I found no source that uses the terms “accreted”, “iatrogenic” or “policy-induced” wickedness, and none that combines neglect of the root cause, symptomatic layering, a beneficiary veto and a shift from tractable to wicked. That is a negative search result, so it cannot be fully confirmed.
- “Extremely difficult to unwind” needs narrowing. The idea that nothing is ever removed does not hold. Large units are rarely terminated and comprehensive repeal is rarer still, but single units do die: about 10% of US domestic programmes within a decade, 62% of post-1946 agencies under a broad definition, and 7% in Texas sunset reviews. Quiet dismantling by default also happens (Bauer et al., 2012). The defensible form is “comprehensive unwinding is rare”.
- Base rate. No study I located measures how often accumulated policy is unwound comprehensively without a crisis. “Mostly crisis-driven” is therefore a hypothesis consistent with the cases, not a measured rate.
- Routes that need no crisis. The 1986 Tax Reform Act was a revenue-neutral bundle that traded base broadening for a cut in the top rate from 50% to 28%. Its gains eroded only in part. Rates rose in 1990 and 1993, and tax expenditures fell from about 9% to 6% of GDP, then rose again without returning to the 1985 level. Airline deregulation in 1978 is explained by ideas and expert advocacy, not a crisis in the sector. Whether stagflation was the trigger is contested, and I could not settle it.
Two further points:
- Manufactured doubt speeds the process up, but accretion does not need it. In tobacco and lead, incumbents pushed \(\varphi\) down, which lengthens chains and connects to P11. But the four current chains above accrete without any documented doubt campaign. Attribution decay, the mismatch between who bears costs and who holds the veto, and policy feedback are enough on their own.
- Complexity makes unwinding without a crisis rarer. As veto groups multiply, the room for a bargain shrinks. Olson’s (1982) sclerosis thesis says that distributional coalitions accumulate in stable societies and slow growth. A summary of the tests as merely “mixed” undersells them: the thesis is “generally, but certainly not universally, supported” (Heckelman, 2007), although the coalition mechanism itself has only weak support (Bischoff, 2007). Tainter’s (1988) argument about declining returns to complexity points the same way.
G.3 The Lateral-Connection Problem
- Chains cross domains, but institutions stay inside them. Mandates, budgets and data are siloed. The finance ministry does not own social-security outcomes, the energy regulator does not own insurance, and the education ministry does not own platform design. The 9/11 Commission found that without integrated all-source analysis “it is not possible to ‘connect the dots’”, which is the same problem in intelligence. Vaughan’s “structural secrecy” and Tett’s work on silos describe it inside organisations, though I did not read either source directly.
- Institutions that span domains are fragile. The US Office of Technology Assessment was created in 1972 to assess technology across congressional committees and defunded in 1995. Its statute was never repealed. In model terms this is erosion of \(M\), the institutional-memory term, at exactly the point where chains cross mandates.
- Early catches leave no trace. A chain intercepted early produces no downstream harm, no crisis and no case record, so the evidence is biased toward failures. The defensible claim is that chains are rarely caught early and that the successes go unseen.
G.4 Predictions
None of the predictions below has been tested. I propose them here.
| # | Prediction | Model term tested | What would falsify it | Data or design | Basis |
|---|---|---|---|---|---|
| P13 | Fixes land near the symptom. The probability of a response at the root falls with causal distance from the visible harm, and the response targets the nearest attributable link with the lowest \(V\). | \(k^* = \arg\min_k V_k\) subject to \(\varphi_k H_k \ge \theta\) | Where responses land is uncorrelated with causal distance or with link-level veto | Code enacted measures in a policy-agenda dataset by their position on documented causal chains (e.g. the EEA Late lessons cases) | G.1, point 3 |
| P14 | Attribution decays at agentive links, and elites track it more than publics do. Holding the harm constant, attribution to a policy root falls as the chain from root to harm lengthens. Most of the loss occurs at links where an intervening actor (an insurer, utility or local official) offers a nearer target. Physical links pass attribution back to a human or policy root with little loss. Legislators’ attribution and choice of instrument respond to traceability more than mass attribution does. Partisan cues gate each link. | \(\varphi_k \approx \varphi_0 \prod_{j=1}^{k} a_j + M\), with \(a_j = a(\text{type}_j, \pi_i)\): low for agentive links, near 1 for physical links, filtered by party alignment \(\pi_i\). Veto holders can lower \(a_j\) on purpose (Hood’s blame avoidance; Arnold’s link-breaking). | (a) Attribution flat across chain depth. (b) Equal decay at physical and agentive links. (c) Publics’ attribution as sensitive to depth as elites’. (d) No partisan gating once role information is supplied. | A survey experiment presenting the same harm at depths 1 to 4, crossing link type (physical vs intervening agent), party cue and role information, run in parallel on a public sample and on legislators or staff (the design of Mildenberger & Sahn, 2025). Separately, coding media content for chains, with episodic or thematic framing as a covariate (Iyengar, 1991). | G.1; Arnold (1990); Mildenberger & Sahn (2025); Engelmann & Waldmann (2022); Hilton et al. (2010) |
| P15 | Symptomatic fixes crowd out the cure. Policy momentum at the root (bills, hearings, budget) falls after a downstream fix is adopted. | Shifting the burden: \(H_{\text{root}} - R_k\) | Root momentum unchanged or rising after downstream adoption | Event study of GLP-1 coverage decisions against food-policy activity, and of insurance backstops against climate bills | G.1, point 4 |
| P16 | Reform waits for a carrier. Action at the root tracks the appearance of a cost-bearer with leverage over the veto holders, not the severity of downstream harm. | Carrier raising \(H_{\text{elite}}\) in \(V\) | Root action predicted by harm severity, not by the arrival of a carrier | Historical chains coded for carrier dates (tobacco suits, rating actions, insurer exits) | G.1, point 5 |
| P17 | Layers depress reform at the root. Controlling for severity, the probability of root reform falls with the number of symptomatic layers already enacted. | \(V_{\text{root}}(n)\) | No effect of layer count | Panel of policy domains with counts of downstream statutes (the accumulation data of Adam et al.) | G.2 |
| P18 | Symptomatic programmes outlive their cause. Programmes created to treat a downstream harm persist after the root cause is resolved. | Feedback beneficiaries in \(V\) | Programmes terminated promptly once the root is fixed | Programme-survival data (a Berry et al. design) matched to the dates when roots were resolved | G.2 |
| P19 | Successful unwinds are packages. Comprehensive unwinds are bundled loss-sharing packages adopted under the conditions for root reform (a carrier, a crisis reaching many veto groups, or a coalition built on ideas), not piecemeal repeals. | Bargain space vs \(n\) | Successful unwinds are mostly piecemeal | Case set of comprehensive reforms (tax, deregulation, pensions) | G.2; the 1986 tax reform and airline deregulation |
| P20 | More groups, fewer unwinds. The probability of an unwind without a crisis falls with the number of distinct beneficiary groups or statutes in the domain. | \(V_{\text{root}}(n)\) | No relationship, or the reverse | Texas sunset-review outcomes by number of affected statutes and lobby registrations | G.2 |
| P21 | Interception needs a spanning mandate. Early interception happens mainly where one institution’s mandate covers both the root domain and the harm domain. | \(M\); lateral connection | Early interceptions as common where mandates are split | Paired cases with and without a spanning agency (e.g. technology assessments in the OTA era vs after 1995; integrated vs split health and food regulators) | G.3 |
Applied to the three systems in the research question, the predictions say the following. These are forward-looking and cannot yet be checked.
- Credit. P16 predicts that French action on the deficit itself will follow bond-market and EU pressure on the governing coalition, not household distress. P17 predicts that each new compensatory measure makes that action harder.
- Climate. P13 and P15 predict continued spending on insurance backstops and fire suppression ahead of emissions, with action at the root tracking carriers such as insurers and reinsurers.
- AI safety. P13 and P21 predict that AI harms will be handled where they surface (content moderation, fraud, employment law) unless some body has a mandate that covers both AI development and its downstream harms.
Part H: Can Causal AI Break the Trap?
Part G ends on a data problem as much as a political one. Accreted wickedness grows where cause and effect are hard to link across large, heterogeneous, multi-polar networks: attribution decays link by link (P14), cross-domain institutions are fragile (P21), and institutional memory \(M\) erodes. A family of techniques now promises to link causes and effects at that scale. This Part asks what they could fix in the model’s terms, which of their limits are real ceilings, and what their success would cost.
A note on terms. I use “causal model”, “causal discovery” and “causal AI” as names of a model class, as terms of art. They carry no ontological commitment to causes as things in the world. My position throughout is relational: a model embeds relations between actants, and actants affect one another. Whether a given event is “the cause” or “the effect” is moot. This Part is about what the model class does with those relations, and one thing it does, as H.4 shows, is give them a direction.
H.1 Causal Models as a Candidate Solution
The model class has several parts.
- Structural causal models (SCMs). Pearl’s ladder of causation separates association (“seeing”), intervention (“doing”) and counterfactuals (“imagining”). The causal hierarchy theorem shows that the layers “almost never” collapse: for almost any SCM, data at one layer underdetermines the layers above it.
- Causal discovery. PC and FCI (Spirtes, Glymour and Scheines) infer graph structure from conditional independences. FCI allows hidden common causes and returns a partial ancestral graph, which is an equivalence class of graphs. NOTEARS (Zheng et al., 2018) recasts structure learning as continuous optimisation, using an exact smooth characterisation of acyclicity, because the number of directed acyclic graphs grows superexponentially with the number of nodes.
- Causal representation learning. Schölkopf et al. (2021) relate causal inference to open problems in machine learning, including transfer and generalisation, and frame the task of learning causal variables from low-level data.
- Digital twins and world models. The EU’s Destination Earth (ECMWF, ESA, EUMETSAT) began implementation in January 2022 and launched on 10 June 2024 with digital twins for weather extremes and climate adaptation, aiming at a “full” Earth-system twin by 2030. These are mechanistic simulations whose relational structure comes from physics, not from discovery. In my reading they belong to the same family only in the broad sense of models built to answer interventional questions.
- Large language models. On their own, LLMs are not causal models. Zečević et al. (2023) argue that they are at best “causal parrots”: they reproduce correlations between causal statements in their training text, without the causal structure behind them.
What follows in this subsection is my synthesis, built on the findings above. In the model’s terms, causal AI could fix four things.
-
Attribution decay (P14). In
\[\varphi_k \approx \varphi_0 \prod_j a_j + M,\]a model that estimates each link’s strength from pooled data raises low \(a_j\) toward their true values, to the extent that its assumptions hold (see H.2). The product decays less, so harm several links downstream is more often attributed to its root.
- A substitute for spanning mandates (P21). Interception currently needs one institution whose mandate spans root and harm. A shared model that spans the chain could do part of that work without a single spanning agency, because the lateral connection is made in the model instead of in the organisation chart.
- Resisting the erosion of \(M\). A standing model is a form of institutional memory. It need not renormalise its baseline every 2-8 years the way perception does. If it is retrained only on recent data, though, it can inherit a shifting baseline of its own (H.2).
- Equipping carriers. Attribution tools are instruments. The carriers are the litigants, insurers and regulators who pick them up and use them to move costs into the veto holders’ radius. Two precedents show this.
- Extreme-event attribution. World Weather Attribution, founded in 2014, has run more than 100 rapid studies under a published protocol. In Lliuya v RWE, decided by the Hamm Higher Regional Court on 28 May 2025, the court held that liability under German property law is not excluded in principle when a major emitter contributes, in proportion to its share of emissions, to climate risks to property abroad. It then adopted its own court-appointed experts’ site-specific estimate of the flood risk to the claimant’s property (about 1% over 30 years), rejected reliance on abstract “climate factors”, and dismissed the appeal. No damages were awarded. The suit was filed in 2015, before the main attribution study of the glacier was published, so the litigant acted first and the science followed. Attribution has helped open legal standing in principle, but it has not yet carried a damages award. A review of 73 lawsuits found that the evidence submitted “lags considerably behind” the state of the science (Stuart-Smith et al., 2021). I could not confirm that attribution has entered insurance pricing; insurers price with catastrophe models, which are a different tool.
- Pharmacovigilance. Disproportionality methods, such as the proportional reporting ratio and the WHO Uppsala centre’s Bayesian neural network (in routine use since 1998), detect drug-safety signals in millions of spontaneous reports. Here too the carriers are the regulators who act on the signals.
H.2 Limits, Reclassified
Suppose causal models are run the way frontier labs run LLMs: retrained on fresh data and re-released, with the aim of updating close to continuously. Current frontier practice is in fact periodic retraining with versioned releases, and the boundary between training and deployment is itself treated as a boundary for audit; I could not fully confirm this, but continuous updating of deployed weights is not the norm. The scenario below is the limiting case.
Continuous updating addresses non-stationarity and drift. A model retrained on recent data tracks a moving world. Policy actions, once logged with their timing and targets, can serve as interventions or natural experiments that move the model up Pearl’s ladder from seeing to doing. (This is my own argument.)
Two residual limits are ceilings.
- Hidden confounders. Without assumptions or interventions, observational data cannot settle interventional questions; that is what the causal hierarchy theorem says. FCI tolerates hidden confounders only by returning an equivalence class in which some edge directions stay open. Continuous updating adds data at the same layer of the ladder and does not climb it.
- Performative prediction. When predictions drive decisions, they change the distribution they predict. Perdomo et al. (2020) show that repeated retraining converges, under conditions, to a performatively stable point, and that “performatively stable classifiers need not be performatively optimal”. A causal model that informs policy is retrained on a world its own outputs have shaped. It can settle on a fixed point that is self-consistent yet untrue to the world the policy would otherwise have produced. Continuous updating cannot remove this ceiling, because updating is its mechanism.
Other limits are risks or governance questions, and could in principle be managed. The mapping below is my synthesis, drawing on findings from earlier Parts.
- Partisan filtering of outputs. The model’s attribution enters \(\varphi\) through the same partisan gate \(\pi\) as any other signal (Hazlett & Mildenberger, 2020). A better \(a_j\) does not raise \(\varphi\) for people who discount the source.
- Capture of the model. If veto holders fund, train or license the model, \(\varphi\) becomes endogenous to \(V\), as with the manufacture of doubt over tobacco and lead. P11 then applies to the model itself.
- \(V\) still binds. Where harm is delayed and \(L^R\) is large, detection is rarely the bottleneck. Where harm is immediate and attributable, detection does decide the outcome: thalidomide was withdrawn within about ten days. Rofecoxib’s heart-attack signal appeared in the VIGOR trial in 2000 and was attributed to naproxen’s cardioprotection. The drug was withdrawn only in September 2004, after more than 80 million patients had taken it, and a cumulative meta-analysis concluded that it should have gone years earlier. Tobacco’s harms were attributed in 1964; root action waited for the state Medicaid suits and the 1998 settlement. Attribution raises \(\varphi H\), but by itself it does not raise \(H_{\text{elite}}\).
- Institutional data silos. A model that spans a chain needs data that span it. Mandates, budgets and data are siloed (see Part G), so the problem of lateral connection moves from the organisation chart into data governance.
H.3 Reification as the Cost of Success
Every limit in H.2 is worst when causal AI fails or is captured. One limit differs: it belongs to the success scenario and worsens the more the system succeeds. Successful causal AI black-boxes the tracing of causal relations itself. The argument in this subsection is mostly my own, built on the studies cited.
(i) Inscrutable by scale. An SCM’s graph is explicit: every node and edge can in principle be inspected. Advocates use this to claim that causal AI does not operate as a black box. A graph with millions of nodes, re-estimated as data arrive, is still beyond any human’s tracing. Burrell (2016) separates three kinds of opacity: secrecy, technical illiteracy, and opacity arising from “the characteristics of machine learning algorithms and the scale required to apply them usefully”. An explicit graph removes the first two and leaves the third untouched. Rudin argues for inherently interpretable models in high-stakes decisions, but that remedy presumes a model a person can read.
(ii) Continuous updating destroys the stable referent that tracing needs. To trace a diagnosis back through a model, the model has to stay still long enough to be traced. Machine-learning engineering already recognises that in an entangled system “Changing Anything Changes Everything” (Sculley et al., 2015). A continuously updating model is a moving target that cannot be versioned or certified once, though I could not find this stated as a settled result. The fix for H.2’s drift problem causes H.3’s traceability problem: the faster the model updates, the better it tracks the world and the less any past output can be reconstructed. A frozen model can be traced but drifts, and no setting of the update rate removes both costs.
(iii) Atrophy. The institutional capacity to trace wastes away when it is not used.
- Bainbridge (1983) named the problem: skills “deteriorate when they are not used”, so a formerly experienced operator who has been monitoring becomes an inexperienced one, exactly when the automation fails.
- Automation complacency and automation bias occur in experts, are not overcome by practice, and cannot be prevented by training or instructions (Parasuraman & Manzey, 2010).
- For Air France 447 (2009), the final report of the Bureau d’Enquêtes et d’Analyses (BEA, 2012), published in July 2012, cites the absence of high-altitude training in manual handling among the causes, and recommends mandatory regular exercises in manual handling of approach to stall and stall recovery. Elish (2019) uses the same accident to describe the “moral crumple zone”: responsibility lands on the nearest human operator, who had limited control over the automated system.
- In four Polish endoscopy centres, the adenoma detection rate in colonoscopies performed without AI fell from 28.4% (226/795) to 22.4% (145/648) after the centres introduced AI-assisted detection (Budzyń et al., 2025; odds ratio for AI exposure 0.69). The design is an observational before-and-after comparison that the authors call hypothesis-generating, so the causal reading is not established.
- The end state is epistemic dependence without a check. Hardwig (1985) shows that depending on experts is rational when one has good reason to think they have good reasons. When the expert is a model that neither society nor its operators can trace, those reasons are no longer available to anyone. Nobody can say why a diagnostic, predictive or prescriptive output was produced, because every route to the answer runs through the model. Messeri and Crockett (2024) describe the scientific version: AI tools can produce “illusions of understanding” and scientific monocultures.
My own model predicts the atrophy. Maintaining an unused capacity is \(M\), and the model in Part B (B.4.1) predicts that \(M\) erodes under fiscal pressure: the late-Qing granaries decayed with fiscal distress (Will & Wong, 1991), and the US Office of Technology Assessment was defunded in 1995. Human tracing capacity kept in reserve beside a model that usually works is the same kind of standing buffer. It costs money every year and pays off only in the year the model fails, which makes it the first candidate for cuts.
The causal model as the ultimate accreted layer. Put (i) to (iii) together with the account of accretion in Part G. The model:
- has beneficiaries: its operators, the firms and agencies whose decisions it licenses, and the downstream programmes calibrated to its outputs, who join the veto against changing it (Pierson’s policy feedback);
- cannot be traced in practice, so it cannot be unwound, because removing a layer requires knowing what it holds up;
- gives its operators an epistemic veto over what counts as a cause, because contesting an attribution means contesting the model, and only they can open it.
This is accreted wickedness in its most complete form: a layer adopted to see through the layers beneath it.
It is a risk and not a certainty, and the known mitigations run against documented pressures.
- Frozen and versioned snapshots, so any output can be re-run against the model that produced it. The EU AI Act requires high-risk systems to allow automatic logging of events (Art. 12).
- Provenance logs for data and updates. The same Act requires that human overseers stay aware of the tendency toward “automation bias” and be able to override outputs (Art. 14(4)).
- Mandated human tracing kept in practice, on the model of pilots’ manual flying. That model turns out to be weaker than it looks: manual flying is encouraged, not mandated. SAFO 13002 (Federal Aviation Administration [FAA], 2013) “encourages operators to promote manual flight operations”, and a 2016 Inspector General audit found the FAA had not determined whether carriers had increased manual flying as a result. The aviation precedent is therefore evidence for the risk as well as a template for the mitigation. Thirty years after Bainbridge, and with a fatal accident on record, the practice is advisory and unmeasured.
Each mitigation is a standing cost with a deferred, uncertain benefit. Under the fiscal erosion of \(M\) described in B.4.1, they are the parts of the system most likely to be cut.
H.4 The ANT Lineage
The argument of H.3 is close to actor-network theory’s founding observations about how technical success disappears from view. Below I trace each step to its source, map it to the model, and state the ontological position that follows.
1. Black-boxing (Latour, 1987, 1999). In Science in Action Latour borrows “black box” from cybernetics: a device too complex to describe is replaced by a box “about which they need to know nothing but its input and output” (Latour, 1987, pp. 2-3). The glossary of Pandora’s Hope defines blackboxing as the way technical work is “made invisible by its own success”, and adds that the more science and technology succeed, the more opaque they become (Latour, 1999, p. 304). That is H.3’s thesis in Latour’s words: the cost of success is the definition of black-boxing, and no malfunction is involved. Callon and Latour (1981) had already tied black boxes to power: “An actor grows with the number of relations he or she can put… in black boxes”, and a black box “contains that which no longer needs to be reconsidered”. In the model, each layer \(\ell\) in \(V_{\text{root}}(n)\) is a black box that its beneficiaries no longer need to reconsider. The causal model is the black box on which reconsidering any of the others comes to depend.
2. Punctualisation (Law, 1992). A network that acts as a single unit is punctualised: “the appearance of unity, and the disappearance of network, has to do with simplification”. Widely performed networks are the ones most easily punctualised, and any actor is a punctualised network that can be unpacked again. Punctualisation holds until breakdown. In the model, a widely adopted causal model punctualises the whole chain it describes: data pipelines, estimation choices, update schedules, operators and the institutions that consume its outputs all appear as one source of attributions.
3. The model’s variables are punctualisations. This is my ontological position, and it follows directly from Law. \(V\), \(L^R\), the trust radius \(R\) and \(M\) are not pre-given structural forces. They are punctualised summaries of networks of associations that are continually performed and maintained. Elites, the power they are afforded and a radius of trust cannot emerge out of nothing; each is assembled. Latour’s “The powers of association” makes the point for power itself: power “must be treated as a consequence rather than as a cause of action” (Latour, 1986, p. 264), and “power” is a convenient way to summarise the consequence of a collective action, with no power to explain what holds it in place. Callon and Latour (1981) make it for macro-actors: a macro-actor is a micro-actor seated on black boxes, and black boxes never remain fully closed. The formal model of Part B (B.4 and B.4.1) is therefore a black-boxed description of network effects. Three consequences follow; they are my synthesis from Callon and Latour (1981), Latour (1986) and Law (1992).
- Carriers are de-punctualisers. If \(V\) is performed, it can be reopened. The carriers of Part G are actants that reopen the black box of \(V\) by re-associating a downstream harm with the veto holders’ own network. State attorneys general and Medicaid cost-recovery suits re-associated smokers’ disease with state budgets. The US valuation of skin-cancer costs re-associated distant ozone loss with American citizens. The Lliuya litigation, drawing on attribution science, re-associated a flood risk in the Andes with a German utility’s emissions.
- The H.3 risk is the inverse. A widely adopted causal model is a new punctualisation, harder to reopen than \(V\), because the associations it summarises are too many and change too fast to unpack (H.3, points i and ii). Its operators become the obligatory passage point (point 4 below). Carriers depend on being able to open black boxes, and the causal model is the black box through which every future carrier would have to pass.
- Method. The variables’ values must be traced in each case: who assembles the veto, through which associations, and with what materials. They cannot be assumed. This strengthens Part F’s requirement to code parameters before outcomes are known: coding \(V\) in advance means tracing its network in advance, which a list of office-holders does not do.
4. The sociology of translation and the obligatory passage point (Callon, 1986). In the St Brieuc Bay study, three researchers try to become indispensable to scallops, fishermen and scientific colleagues through four moments. In problematisation they define the others’ problems and make their own research programme the “obligatory passage point”. Interessement locks the others into proposed roles, enrolment defines and interrelates those roles, and mobilisation ensures that spokesmen actually represent their collectivities. Callon’s method rests on agnosticism, generalised symmetry and free association. In the model, the operators of a widely adopted causal model problematise policy disputes as questions the model answers, and so make the model the obligatory passage point. Every attribution, and every carrier that depends on one, must pass through it. That is H.3’s epistemic veto in Callon’s vocabulary. Callon’s case also shows the counter-move. The translation came apart in dissidence: in later years the larvae did not anchor, and fishermen fished the protected stock one Christmas Eve, so the researchers’ claim to represent both was “brought into question”. A model’s status as passage point likewise lasts only while the actants it speaks for do not betray their spokesmen.
5. Irreversibility (Callon, 1991). Callon’s paper on techno-economic networks asks how some links “achieve longevity and tend to shape future processes of translation”. Irreversibility is usually glossed in two parts (I have not checked this gloss against the original): the network cannot return to a point where alternative translations were possible, and it shapes the translations that follow. In the model, “extremely difficult to unwind” (Part G) is irreversibility. A causal model that has been used to calibrate programmes, liabilities and prices has shaped the later translations that would be needed to replace it.
6. Centres of calculation and immutable mobiles (Latour, 1987). Networks make distant things mobile, stable and combinable so that they can be accumulated at a centre and acted on from there; the centre’s “theory” is the crossroads where traces are combined and rewritten (Science in Action, ch. 6). In the model, the causal model is a centre of calculation for chains that cross domains. Its outputs (an attribution fraction, a risk score, a recommended intervention) travel as immutable mobiles into courts, insurers’ tables and budget documents, detached from the estimation that produced them. They keep their form while losing their history, which makes them useful to carriers and hard to contest.
7. Delegation and scripts (Akrich, 1992; Latour, 1992). Akrich’s script analysis follows how designers inscribe a world into an object and how users de-scribe it in use. Latour’s door-closer (the “groom”) replaces an unreliable human porter with a delegated non-human that prescribes back what kind of people may pass. Akrich is also read as saying that objects have to efface themselves as they become indispensable, though I could not confirm this in her text. In the model, tracing competence is delegated to a non-human, and the delegation prescribes back. Once the model traces, institutions are reorganised around consuming its traces, and the human role it replaced is the one that atrophies (H.3, point iii).
8. Mediators, intermediaries and direction. For Latour (2005, p. 39), an intermediary transports meaning or force without transformation, so “defining its inputs is enough to define its outputs”, while mediators “transform, translate, distort, and modify” what they carry. A causal model is presented as an intermediary, a transparent conduit from data to causes. It is a mediator. My relational position and ANT agree here: a model only embeds relations, actants affect one another, and whether an event is a cause or an effect is moot. What the model class adds is direction.
- SCMs are directional. Their edges are asymmetric, and the well-studied subclass is acyclic. Bongers et al. (2021) show that once cycles are allowed, “many of the convenient properties of acyclic SCMs do not hold in general”: solutions may not exist, distributions may not be unique, Markov properties may fail and graphs may not match their causal semantics. Only a restricted class of “simple” cyclic SCMs recovers most of those properties. NOTEARS makes acyclicity an explicit constraint of the optimisation.
- So the model inscribes direction onto mutual relations. Feedback is the normal condition of the chains in Part G (debt and spreads, insurance withdrawal and development, platform design and use). In a causal model it is either cut into a directed acyclic graph or handled by a narrower class of cyclic models. In Akrich’s terms this is an inscription. It also resembles what Latour calls purification, with one caveat on attribution. In We Have Never Been Modern, purification is specifically the practice that “creates two entirely distinct ontological zones”, humans and non-humans, while translation creates hybrids (Latour, 1993, pp. 10-11). Applying it to the separation of cause from effect is my extension by analogy, not Latour’s usage.
- The outputs circulate as directional matters of fact. Latour (2004) asks critique to move from “matters of fact” to “matters of concern”: from settled objects to the assemblies needed to hold them in place. A model’s attribution travels as a matter of fact (“X caused 30% of Y”) with the direction already decided. This feeds H.3, since the model black-boxes its reasoning and also the imposition of direction itself. What could be reopened as a matter of concern (who is affected by whom, in which direction, through which associations) arrives closed.
9. Infrastructure becomes visible on breakdown (Star, 1999; Bowker & Star, 1999). Star lists, among infrastructure’s properties, that it “becomes visible upon breakdown” (Star, 1999, p. 382, after Star & Ruhleder, 1996). Bowker and Star’s infrastructural inversion is the method of forcing the invisible underpinning into view, as they do for the International Classification of Diseases, “an invisible underpinning to medical practice”. In the model, a working causal model is infrastructure. It becomes visible when it fails, and H.3 (iii) predicts that by then the people able to inspect it may have gone. Infrastructural inversion is the research programme a mitigation regime would need to institutionalise.
10. Performativity (Callon, 1998; MacKenzie, 2006) and performative prediction. Callon argues that economics “performs, shapes and formats the economy, rather than observing how it functions” (Callon, 1998, p. 2). MacKenzie distinguishes generic, effective and Barnesian performativity, in which use of a model makes the world more like its depiction, from counterperformativity, in which use makes the world less like it. Options pricing after Black-Scholes-Merton is his strongest case. The performatively stable point of Perdomo et al. (2020), discussed in H.2, formalises the same family of effects for machine learning, and its originators have drawn the link themselves, noting that for MacKenzie it is the practice of applying a theory, more than the predictions as such, that is performative. In the model, a causal model used for policy is Barnesian when its attributions shape the interventions that generate its next training data. Its convergence to a stable point is then evidence of its performative success, and says nothing about its truth.
11. Reification and how ANT reworks it. Lukács (1923/1971) describes reification as the process by which “a relation between people takes on the character of a thing” and acquires a “phantom objectivity”. Berger and Luckmann (1966) generalise it: reification is “the apprehension of human phenomena as if they were things”, in which people forget their own authorship of the human world. ANT keeps the observation and drops the diagnosis of false consciousness. Latour rejects “critical sociology” that replaces actors’ accounts with hidden social forces and treats their objections as proof of the explanation; for ANT, actors are “much more than mere informants” (Latour, 2005). In ANT terms reification is punctualisation that has stopped being reopened, a practical achievement of the network and no illusion in anyone’s head. That is the sense in which my earlier essay used it: “the thoughts that form actor networks become increasingly embedded until their origins are forgotten.” In the model, then, the risk in H.3 is that the associations needed to reopen the model lapse, whether or not anyone is deceived by it.
12. Summary mapping. The table below is my synthesis.
| ANT concept | Source | What it maps to in the model | Step in H.3 |
|---|---|---|---|
| Black-boxing | Latour (1987, 1999); Callon & Latour (1981) | Each accreted layer in \(V_{\text{root}}(n)\); the causal model as the black box over the others | The cost of success |
| Punctualisation | Law (1992) | \(V\), \(L^R\), \(R\) and \(M\) as punctualised network effects; the model as a punctualisation of the chain | (i) Opacity by scale |
| Power as consequence | Latour (1986) | \(V\) as performed, so carriers can reopen it | Carriers against the model |
| Translation, obligatory passage point | Callon (1986) | Operators as the passage point; the epistemic veto | The epistemic veto |
| Irreversibility | Callon (1991) | “Extremely difficult to unwind” (Part G) | Cannot be unwound |
| Centres of calculation, immutable mobiles | Latour (1987) | Model outputs travel as carriers, detached from how they were produced | (ii) No stable referent |
| Delegation, script | Akrich (1992); Latour (1992) | Tracing delegated to a non-human; \(M\) atrophies | (iii) Atrophy |
| Mediator and intermediary; purification (by analogy) | Latour (2005, 1993) | Direction inscribed on mutual relations; attribution \(a_j\) as a mediated output | Black-boxing of direction |
| Visible on breakdown; infrastructural inversion | Star (1999); Bowker & Star (1999) | \(M\) as reserve capacity, visible only when needed | (iii) Atrophy |
| Performativity | Callon (1998); MacKenzie (2006) | Performatively stable \(\varphi\); the model shapes its own data | The ceiling in H.2 |
| Reification, reworked | Lukács (1923/1971); Berger & Luckmann (1966); Latour (2005) | Punctualisation that is no longer reopened | The whole argument |
| Matters of fact and of concern | Latour (2004) | Attribution as settled fact, against attribution as an assembly to trace | Black-boxing of direction |
H.5 Predictions
All three predictions below are proposed and untested. In ANT terms, P22 tests whether attribution tools, in carriers’ hands, de-punctualise \(V\); P23 tests whether the model’s own punctualisation erodes the capacity to reopen it; and P24 tests whether its operators become the obligatory passage point.
P22. Attribution speeds carriers, not reform. Where attribution tools become available for a harm, carriers emerge faster (litigation filed, insurance repriced, regulatory standing granted), but root reform still waits for the conditions on \(V\): harm in the veto holders’ radius, a crisis reaching many veto groups, or elite displacement.
- Model term tested: carrier emergence against \(V(H_{\text{elite}})\).
- Falsified if: root reform follows attribution capability directly, without a carrier, or carriers are no faster after attribution becomes available.
- Data or design: an event study around the first attribution studies for a hazard class (World Weather Attribution event types; pharmacovigilance signals), set against carrier dates and root-reform dates; the Sabin Center litigation database.
- Basis: H.1 and Part G.
P23. Delegated tracing impairs unassisted proficiency, most in novices and for cognitive tasks, and its maintenance is cut first. Where diagnostic or causal tracing is delegated to models:
- (a) people trained with the model reach lower unassisted proficiency than people trained without it;
- (b) experienced practitioners’ unassisted proficiency declines with time since their last unassisted practice, faster for cognitive monitoring and diagnostic judgement than for perceptual-motor execution;
- (c) active engagement (verifying outputs, asking for explanations, guardrails that withhold answers) weakens (a) and (b);
- (d) mandates to maintain unassisted proficiency erode first under fiscal pressure.
Automation bias while assisted is a separate, immediate effect and does not count as evidence for (a) or (b).
- Model term tested: erosion of \(M\), through (a) failed formation, (b) atrophy through disuse (H.3, point iii) and (d) fiscal erosion of \(M\) (B.4.1).
- Falsified if: for (a) and (b), unassisted proficiency at 12 months or more is no lower in exposed units than in unexposed units, or there is no gradient between novices and experts, or between cognitive and motor tasks; for (c), engagement shows no moderating effect; for (d), maintenance mandates survive fiscal consolidation at rates no lower than other functions.
- Data or design: a stepped-wedge cluster trial of model deployment with periodic unassisted probes, recording case mix and procedural covariates, extending and replicating Budzyń et al. (2025); novice-cohort randomised trials on the designs of Bastani et al. (2025) and Shen and Tamkin (2026); budget lines for oversight and reserve capacity under consolidation.
- Basis: H.3; B.4.1; Bainbridge (1983); Parasuraman and Manzey (2010); Budzyń et al. (2025); Casner et al. (2014); Arthur et al. (1998); Haslbeck and Hoermann (2016).
P24. Disputes move from causes to access. Where one causal model becomes widely adopted in a policy domain, its operators become an obligatory passage point, and policy disputes shift from contesting causes to contesting access to, or control of, the model (data access, audit rights, licensing, who may retrain it).
- Model term tested: the obligatory passage point and the epistemic veto.
- Falsified if: disputes continue to contest causal claims directly at similar rates after adoption, or access disputes do not rise.
- Data or design: content coding of regulatory proceedings and litigation before and after adoption of a shared model; disputes over researcher access under the EU’s Digital Services Act as a near analogue.
- Basis: H.3 and H.4, point 4.
Applied to the three systems in the research question, the predictions look forward and are unverified.
- Credit: P22 predicts that better attribution of French fiscal spill-overs speeds rating and market repricing (carriers) without itself producing deficit correction.
- Climate: P22 and P24 predict that attribution and digital twins speed liability claims and repricing, and that disputes shift toward who runs and audits the twins.
- AI safety: P23 predicts that as AI systems are used to audit other AI systems, human auditing capacity declines, and that its maintenance is the first oversight cost cut.
H.6 Concluding Synthesis
This closing argument is mine. My earlier essay argued that LLMs reify language at light speed: a translation that standardises instead of diversifying, producing simulacra, copies detached from any original. This report has traced a slower version of the same process in policy. Root causes go untraced, symptomatic layers accrete, and each layer is punctualised by the beneficiaries who come to depend on it, until a tractable problem is wicked and cannot be unwound. Causal AI is the obvious instrument for breaking that trap, because the trap is partly a failure to link causes and effects across networks too large to trace by hand. Part H’s conclusion is that the instrument also risks becoming the trap’s most complete form. A causal model that succeeds is black-boxed by its own success, in exactly Latour’s sense. It inscribes direction onto mutual relations and sends its outputs out as matters of fact. It lets the human capacity to trace waste away as unused \(M\), and it turns its operators into the obligatory passage point for every future carrier. In the essay’s terms it would be a simulacrum of tracing: the form of causal explanation, circulating without the work that once produced it. The mitigations are known: snapshots, provenance, and human tracing kept in practice. My own model predicts that they are the first things to go. P23 tests whether that prediction holds.
References
Adam, C., Hurka, S., Knill, C., & Steinebach, Y. (2019). Policy accumulation and the democratic responsiveness trap. Cambridge University Press. https://doi.org/10.1017/9781108646888
Akrich, M. (1992). The de-scription of technical objects. In W. E. Bijker & J. Law (Eds.), Shaping technology/building society (pp. 205-224). MIT Press.
Alesina, A., & Drazen, A. (1991). Why are stabilizations delayed? American Economic Review, 81(5), 1170-1188.
Alleway, H. K., Klein, E. S., Cameron, L., Douglass, K., Govia, I., Guell, C., Lim, M., Robin, L., & Thurstan, R. H. (2023). The shifting baseline syndrome as a connective concept for more informed and just responses to global environmental change. People and Nature, 5(3), 885-896. https://doi.org/10.1002/pan3.10473
Andre, P., Boneva, T., Chopra, F., & Falk, A. (2024). Globally representative evidence on the actual and perceived support for climate action. Nature Climate Change, 14(3), 253-259. https://doi.org/10.1038/s41558-024-01925-3
Arcand, J.-L., Berkes, E., & Panizza, U. (2015). Too much finance? Journal of Economic Growth, 20(2), 105-148. https://doi.org/10.1007/s10887-015-9115-2
Arnold, R. D. (1990). The logic of congressional action. Yale University Press.
Arthur, W., Jr., Bennett, W., Jr., Stanush, P. L., & McNelly, T. L. (1998). Factors that influence skill decay and retention: A quantitative review and analysis. Human Performance, 11(1), 57-101. https://doi.org/10.1207/s15327043hup1101_3
Bainbridge, L. (1983). Ironies of automation. Automatica, 19(6), 775-779. https://doi.org/10.1016/0005-1098(83)90046-8
Baker, J. A., Bell, M. J., Jackson, L. C., Vallis, G. K., Watson, A. J., & Wood, R. A. (2025). Continued Atlantic overturning circulation even under climate extremes. Nature, 638(8052), 987-994. https://doi.org/10.1038/s41586-024-08544-0
Banfield, E. C. (1958). The moral basis of a backward society. Free Press.
Bareinboim, E., Correa, J. D., Ibeling, D., & Icard, T. (2022). On Pearl’s hierarchy and the foundations of causal inference. In H. Geffner, R. Dechter, & J. Y. Halpern (Eds.), Probabilistic and causal inference: The works of Judea Pearl (pp. 507-556). ACM Books. https://doi.org/10.1145/3501714.3501743
Barnett, J., & O’Neill, S. (2010). Maladaptation. Global Environmental Change, 20(2), 211-213. https://doi.org/10.1016/j.gloenvcha.2009.11.004
Barrett, S. (2003). Environment and statecraft: The strategy of environmental treaty-making. Oxford University Press.
Bastani, H., Bastani, O., Sungu, A., Ge, H., Kabakcı, Ö., & Mariman, R. (2025). Generative AI without guardrails can harm learning: Evidence from high school mathematics. Proceedings of the National Academy of Sciences, 122(26), Article e2422633122. https://doi.org/10.1073/pnas.2422633122
Bauer, M. W., Jordan, A., Green-Pedersen, C., & Héritier, A. (Eds.). (2012). Dismantling public policy: Preferences, strategies, and effects. Oxford University Press. https://doi.org/10.1093/acprof:oso/9780199656646.001.0001
Baumgartner, F. R., & Jones, B. D. (1993). Agendas and instability in American politics. University of Chicago Press.
Bazerman, M. H., & Watkins, M. D. (2004). Predictable surprises: The disasters you should have seen coming, and how to prevent them. Harvard Business School Press.
Beck, U. (1992). Risk society: Towards a new modernity. Sage. (Original work published 1986)
Bender, E. M. (2022, September 14). On the dangers of stochastic parrots: Can language models be too big? [Presentation slides]. AI Sweden & RISE NLP. https://faculty.washington.edu/ebender/papers/Bender-2022-Sept-14.pdf
Berger, P. L., & Luckmann, T. (1966). The social construction of reality. Doubleday.
Beshears, J., Choi, J. J., Laibson, D., Madrian, B. C., & Milkman, K. L. (2015). The effect of providing peer information on retirement savings decisions. The Journal of Finance, 70(3), 1161-1201. https://doi.org/10.1111/jofi.12258
Besley, T., & Burgess, R. (2002). The political economy of government responsiveness: Theory and evidence from India. Quarterly Journal of Economics, 117(4), 1415-1451. https://doi.org/10.1162/003355302320935061
Birkland, T. A. (1998). Focusing events, mobilization, and agenda setting. Journal of Public Policy, 18(1), 53-74. https://doi.org/10.1017/S0143814X98000038
Bischoff, I. (2007). Model uncertainty, political learning, and institutions: A broader view on Mancur Olson’s theory of institutional sclerosis. Southern Economic Journal, 74(1), 34-49. https://doi.org/10.1002/j.2325-8012.2007.tb00825.x
Bongers, S., Forré, P., Peters, J., & Mooij, J. M. (2021). Foundations of structural causal models with cycles and latent variables. The Annals of Statistics, 49(5), 2885-2915. https://doi.org/10.1214/21-AOS2064
Bowker, G. C., & Star, S. L. (1999). Sorting things out: Classification and its consequences. MIT Press. https://doi.org/10.7551/mitpress/6352.001.0001
Budzyń, K., Romańczyk, M., Kitala, D., Kołodziej, P., Bugajski, M., Adami, H. O., Blom, J., Buszkiewicz, M., Halvorsen, N., Hassan, C., Romańczyk, T., Holme, Ø., Jarus, K., Fielding, S., Kunar, M., Pellise, M., Pilonis, N., Kamiński, M. F., Kalager, M., . . . Mori, Y. (2025). Endoscopist deskilling risk after exposure to artificial intelligence in colonoscopy: A multicentre, observational study. The Lancet Gastroenterology & Hepatology, 10(10), 896-903. https://doi.org/10.1016/S2468-1253(25)00133-5
Bureau d’Enquêtes et d’Analyses pour la sécurité de l’aviation civile. (2012). Final report on the accident on 1st June 2009 to the Airbus A330-203 registered F-GZCP operated by Air France flight AF 447 Rio de Janeiro-Paris.
Burrell, J. (2016). How the machine “thinks”: Understanding opacity in machine learning algorithms. Big Data & Society, 3(1). https://doi.org/10.1177/2053951715622512
Bursztyn, L., Handel, B., Jiménez-Durán, R., & Roth, C. (2025). When product markets become collective traps: The case of social media. American Economic Review, 115(12), 4105-4136. https://doi.org/10.1257/aer.20231468
Caesar, L., Rahmstorf, S., Robinson, A., Feulner, G., & Saba, V. (2018). Observed fingerprint of a weakening Atlantic Ocean overturning circulation. Nature, 556(7700), 191-196. https://doi.org/10.1038/s41586-018-0006-5
Cai, W., Borlace, S., Lengaigne, M., van Rensch, P., Collins, M., Vecchi, G., Timmermann, A., Santoso, A., McPhaden, M. J., Wu, L., England, M. H., Wang, G., Guilyardi, E., & Jin, F.-F. (2014). Increasing frequency of extreme El Niño events due to greenhouse warming. Nature Climate Change, 4(2), 111-116. https://doi.org/10.1038/nclimate2100
Cai, W., Wang, G., Santoso, A., Lin, X., & Wu, L. (2017). Definition of extreme El Niño and its impact on projected increase in extreme El Niño frequency. Geophysical Research Letters, 44(21). https://doi.org/10.1002/2017GL075635
Callon, M. (1986). Some elements of a sociology of translation: Domestication of the scallops and the fishermen of St Brieuc Bay. In J. Law (Ed.), Power, action and belief (pp. 196-233). Routledge & Kegan Paul.
Callon, M. (1991). Techno-economic networks and irreversibility. In J. Law (Ed.), A sociology of monsters (pp. 132-161). Routledge.
Callon, M. (1998). Introduction: The embeddedness of economic markets in economics. In M. Callon (Ed.), The laws of the markets (pp. 1-57). Blackwell.
Callon, M., & Latour, B. (1981). Unscrewing the big Leviathan. In K. Knorr Cetina & A. V. Cicourel (Eds.), Advances in social theory and methodology (pp. 277-303). Routledge & Kegan Paul.
Carney, M. (2015, September 29). Breaking the tragedy of the horizon: Climate change and financial stability [Speech]. Bank of England. https://www.bis.org/review/r151009a.pdf
Casner, S. M., Geven, R. W., Recker, M. P., & Schooler, J. W. (2014). The retention of manual flying skills in the automated cockpit. Human Factors, 56(8), 1506-1516. https://doi.org/10.1177/0018720814535628
Centola, D., Becker, J., Brackbill, D., & Baronchelli, A. (2018). Experimental evidence for tipping points in social convention. Science, 360(6393), 1116-1119. https://doi.org/10.1126/science.aas8827
Chenoweth, E. (2020a). Questions, answers, and some cautionary updates regarding the 3.5% rule (Carr Center Discussion Paper 2020-005). Harvard Kennedy School. https://www.hks.harvard.edu/sites/default/files/2024-05/Erica%20Chenoweth_2020-005.pdf
Chenoweth, E. (2020b). The future of nonviolent resistance. Journal of Democracy, 31(3), 69-84. https://doi.org/10.1353/jod.2020.0046
Chenoweth, E., & Stephan, M. J. (2011). Why civil resistance works: The strategic logic of nonviolent conflict. Columbia University Press.
Cline, W. R. (2015). Too much finance, or statistical illusion? (Policy Brief PB15-9). Peterson Institute for International Economics. https://www.piie.com/publications/policy-briefs/too-much-finance-or-statistical-illusion
Collingridge, D. (1980). The social control of technology. Frances Pinter.
Council of the European Union. (2024). Council Decision (EU) 2024/2122 of 26 July 2024 on the existence of an excessive deficit in France. Official Journal of the European Union, L 2024/2122. https://eur-lex.europa.eu/eli/dec/2024/2122/oj
Cox, M., Arnold, G., & Villamayor-Tomás, S. (2010). A review of design principles for community-based natural resource management. Ecology and Society, 15(4), Article 38. https://doi.org/10.5751/ES-03704-150438
Darley, J. M., & Latané, B. (1968). Bystander intervention in emergencies: Diffusion of responsibility. Journal of Personality and Social Psychology, 8(4, Pt. 1), 377-383. https://doi.org/10.1037/h0025589
Daviter, F. (2019). Policy analysis in the face of complexity: What kind of knowledge to tackle wicked problems? Public Policy and Administration, 34(1), 62-83. https://doi.org/10.1177/0952076717733325
Delhey, J., Newton, K., & Welzel, C. (2011). How general is trust in “most people”? Solving the radius of trust problem. American Sociological Review, 76(5), 786-807. https://doi.org/10.1177/0003122411420817
Diamond, J. (2005). Collapse: How societies choose to fail or succeed. Viking.
Diekmann, A. (1985). Volunteer’s dilemma. Journal of Conflict Resolution, 29(4), 605-610. https://doi.org/10.1177/0022002785029004003
Ditlevsen, P., & Ditlevsen, S. (2023). Warning of a forthcoming collapse of the Atlantic meridional overturning circulation. Nature Communications, 14, Article 4254. https://doi.org/10.1038/s41467-023-39810-w
Drazen, A., & Easterly, W. (2001). Do crises induce reform? Simple empirical tests of conventional wisdom. Economics & Politics, 13(2), 129-157. https://doi.org/10.1111/1468-0343.00087
Drazen, A., & Grilli, V. (1993). The benefit of crises for economic reforms. American Economic Review, 83(3), 598-607.
Drijfhout, S., Angevaare, J. R., Mecking, J., van Westen, R. M., & Rahmstorf, S. (2025). Shutdown of northern Atlantic overturning after 2100 following deep mixing collapse in CMIP6 projections. Environmental Research Letters, 20(9), Article 094062. https://doi.org/10.1088/1748-9326/adfa3b
Dugmore, A. J., McGovern, T. H., Vésteinsson, O., Arneborg, J., Streeter, R., & Keller, C. (2012). Cultural adaptation, compounding vulnerabilities and conjunctures in Norse Greenland. Proceedings of the National Academy of Sciences, 109(10), 3658-3663. https://doi.org/10.1073/pnas.1115292109
Elish, M. C. (2019). Moral crumple zones: Cautionary tales in human-robot interaction. Engaging Science, Technology, and Society, 5, 40-60. https://doi.org/10.17351/ests2019.260
Engelmann, N., & Waldmann, M. R. (2022). How causal structure, causal strength, and foreseeability affect moral judgments. Cognition, 226, Article 105167. https://doi.org/10.1016/j.cognition.2022.105167
European Environment Agency. (2001). Late lessons from early warnings: The precautionary principle 1896-2000 (Environmental Issue Report No. 22). https://www.eea.europa.eu/en/analysis/publications/environmental_issue_report_2001_22
European Environment Agency. (2013). Late lessons from early warnings: Science, precaution, innovation (EEA Report No. 1/2013).
Federal Aviation Administration. (2013, January 4). Manual flight operations (Safety Alert for Operators No. 13002).
Fernandez, R., & Rodrik, D. (1991). Resistance to reform: Status quo bias in the presence of individual-specific uncertainty. American Economic Review, 81(5), 1146-1155.
Feygina, I., Jost, J. T., & Goldsmith, R. E. (2010). System justification, the denial of global warming, and the possibility of “system-sanctioned change”. Personality and Social Psychology Bulletin, 36(3), 326-338. https://doi.org/10.1177/0146167209351435
Fox-Kemper, B., Hewitt, H. T., Xiao, C., Aðalgeirsdóttir, G., Drijfhout, S. S., Edwards, T. L., Golledge, N. R., Hemer, M., Kopp, R. E., Krinner, G., Mix, A., Notz, D., Nowicki, S., Nurhati, I. S., Ruiz, L., Sallée, J.-B., Slangen, A. B. A., & Yu, Y. (2021). Ocean, cryosphere and sea level change. In V. Masson-Delmotte et al. (Eds.), Climate change 2021: The physical science basis. Contribution of Working Group I to the Sixth Assessment Report of the Intergovernmental Panel on Climate Change (pp. 1211-1362). Cambridge University Press. https://doi.org/10.1017/9781009157896.011
Foxcroft, D. R., Moreira, M. T., Almeida Santimano, N. M. L., & Smith, L. A. (2015). Social norms information for alcohol misuse in university and college students. Cochrane Database of Systematic Reviews, 2015(12), Article CD006748. https://doi.org/10.1002/14651858.CD006748.pub4
Fukuyama, F. (1995). Trust: The social virtues and the creation of prosperity. Free Press.
Fukuyama, F. (2001). Social capital, civil society and development. Third World Quarterly, 22(1), 7-20. https://doi.org/10.1080/713701144
Gardiner, S. M. (2006). A perfect moral storm: Climate change, intergenerational ethics and the problem of moral corruption. Environmental Values, 15(3), 397-413. https://doi.org/10.3197/096327106778226293
Gardiner, S. M. (2011). A perfect moral storm: The ethical tragedy of climate change. Oxford University Press. https://doi.org/10.1093/acprof:oso/9780195379440.001.0001
Geels, F. W. (2014). Regime resistance against low-carbon transitions: Introducing politics and power into the multi-level perspective. Theory, Culture & Society, 31(5), 21-40. https://doi.org/10.1177/0263276414531627
General Accounting Office. (2001). Tobacco settlement: States’ use of Master Settlement Agreement payments (GAO-01-851). https://www.gao.gov/assets/gao-01-851.pdf
Glynn, C. J., Hayes, A. F., & Shanahan, J. (1997). Perceived support for one’s opinions and willingness to speak out: A meta-analysis of survey studies on the “spiral of silence”. Public Opinion Quarterly, 61(3), 452-463. https://doi.org/10.1086/297808
Graham, M. H., & Svolik, M. W. (2020). Democracy in America? Partisanship, polarization, and the robustness of support for democracy in the United States. American Political Science Review, 114(2), 392-409. https://doi.org/10.1017/S0003055420000052
Granovetter, M. (1978). Threshold models of collective behavior. American Journal of Sociology, 83(6), 1420-1443. https://doi.org/10.1086/226707
Greenwood, R., Hanson, S. G., Shleifer, A., & Sørensen, J. A. (2022). Predictable financial crises. Journal of Finance, 77(2), 863-921. https://doi.org/10.1111/jofi.13105
Grevsmühl, S. V., & Briday, R. (2023). Satellite images as tools of visual diplomacy: NASA’s ozone hole visualizations and the Montreal Protocol negotiations. British Journal for the History of Science, 56(2), 247-267. https://doi.org/10.1017/S000708742300002X
Guttentag, J., & Herring, R. (1986). Disaster myopia in international banking (Essays in International Finance No. 164). Princeton University.
Hallsworth, M., Chadborn, T., Sallis, A., Sanders, M., Berry, D., Greaves, F., Clements, L., & Davies, S. C. (2016). Provision of social norm feedback to high prescribers of antibiotics in general practice: A pragmatic national randomised controlled trial. The Lancet, 387(10029), 1743-1752. https://doi.org/10.1016/S0140-6736(16)00215-4
Hao, K. (2020, December 4). We read the paper that forced Timnit Gebru out of Google. Here’s what it says. MIT Technology Review. https://www.technologyreview.com/2020/12/04/1013294/google-ai-ethics-research-paper-forced-out-timnit-gebru/
Hardin, G. (1968). The tragedy of the commons. Science, 162(3859), 1243-1248. https://doi.org/10.1126/science.162.3859.1243
Hardt, M., & Mendler-Dünner, C. (2023). Performative prediction: Past and future (arXiv:2310.16608). arXiv. https://doi.org/10.48550/arXiv.2310.16608
Hardwig, J. (1985). Epistemic dependence. Journal of Philosophy, 82(7), 335-349. https://doi.org/10.2307/2026523
Haslbeck, A., & Hoermann, H.-J. (2016). Flying the needles. Human Factors, 58(4), 533-545. https://doi.org/10.1177/0018720816640394
Hazlett, C., & Mildenberger, M. (2020). Wildfire exposure increases pro-environment voting within Democratic but not Republican areas. American Political Science Review, 114(4), 1359-1365. https://doi.org/10.1017/S0003055420000441
Head, B. W., & Alford, J. (2015). Wicked problems: Implications for public policy and management. Administration & Society, 47(6), 711-739. https://doi.org/10.1177/0095399713481601
Heckelman, J. C. (2007). Explaining the rain: The Rise and Decline of Nations after 25 years. Southern Economic Journal, 74(1), 18-33. https://doi.org/10.1002/j.2325-8012.2007.tb00824.x
Herndon, T., Ash, M., & Pollin, R. (2014). Does high public debt consistently stifle economic growth? A critique of Reinhart and Rogoff. Cambridge Journal of Economics, 38(2), 257-279. https://doi.org/10.1093/cje/bet075
Hilton, D. J., McClure, J., & Sutton, R. M. (2010). Selecting explanations from causal chains: Do statistical principles explain preferences for voluntary causes? European Journal of Social Psychology, 40(3), 383-400. https://doi.org/10.1002/ejsp.623
Hirschman, A. O. (1970). Exit, voice, and loyalty: Responses to decline in firms, organizations, and states. Harvard University Press.
Hood, C. (2011). The blame game. Princeton University Press. https://doi.org/10.1515/9781400836819
Howe, P. D., Marlon, J. R., Mildenberger, M., & Shield, B. S. (2019). How will climate change shape climate opinion? Environmental Research Letters, 14(11), Article 113001. https://doi.org/10.1088/1748-9326/ab466a
Hoyer, D., Holder, S., Bennett, J. S., Francois, P., Whitehouse, H., Covey, R. A., Feinman, G., Korotayev, A., Ustyuzhanin, V., Preiser-Kapeller, J., Bard, K., Levine, J., Reddish, J., Orlandi, G., Ainsworth, R., & Turchin, P. (2026). All crises are unhappy in their own way: The role of societal instability in shaping the past. Social Science History, 50(2), 314-346. https://doi.org/10.1017/ssh.2025.10113
Institute of International Finance. (2026, September 23). Global debt monitor. Institute of International Finance.
Intergovernmental Panel on Climate Change. (2021). Climate change 2021: The physical science basis. Contribution of Working Group I to the Sixth Assessment Report of the Intergovernmental Panel on Climate Change. https://www.ipcc.ch/report/ar6/wg1/
International Monetary Fund. (2025, September 17). Global debt remains above 235% of world GDP. IMF Blog.
International Monetary Fund. (2026). Fiscal monitor (April 2026). https://www.imf.org/en/publications/fm/issues/2026/04/15/fiscal-monitor-april-2026
Isaac, R. M., Walker, J. M., & Williams, A. W. (1994). Group size and the voluntary provision of public goods. Journal of Public Economics, 54(1), 1-36. https://doi.org/10.1016/0047-2727(94)90068-X
Iyengar, S. (1991). Is anyone responsible? How television frames political issues. University of Chicago Press. https://doi.org/10.7208/chicago/9780226388533.001.0001
Jamieson, D. (2014). Reason in a dark time: Why the struggle against climate change failed, and what it means for our future. Oxford University Press. https://doi.org/10.1093/acprof:oso/9780199337668.001.0001
Jones, B. D., Baumgartner, F. R., Breunig, C., Wlezien, C., Soroka, S., Foucault, M., François, A., Green-Pedersen, C., Koski, C., John, P., Mortensen, P. B., Varone, F., & Walgrave, S. (2009). A general empirical law of public budgets: A comparative analysis. American Journal of Political Science, 53(4), 855-873. https://doi.org/10.1111/j.1540-5907.2009.00405.x
Kahn, A. E. (1966). The tyranny of small decisions: Market failures, imperfections, and the limits of economics. Kyklos, 19(1), 23-47. https://doi.org/10.1111/j.1467-6435.1966.tb02491.x
Kahneman, D., & Tversky, A. (1979). Prospect theory: An analysis of decision under risk. Econometrica, 47(2), 263-291. https://doi.org/10.2307/1914185
Kingdon, J. W. (1984). Agendas, alternatives, and public policies. Little, Brown.
Konrad, K. A. (2025). Multiple teams and the volunteer’s dilemma. Rationality and Society, 37(3), 338-355. https://doi.org/10.1177/10434631251341703
Krippner, G. R. (2005). The financialization of the American economy. Socio-Economic Review, 3(2), 173-208. https://doi.org/10.1093/SER/mwi008
Kuran, T. (1991). Now out of never: The element of surprise in the East European revolution of 1989. World Politics, 44(1), 7-48. https://doi.org/10.2307/2010422
Kuran, T. (1995). Private truths, public lies: The social consequences of preference falsification. Harvard University Press.
Laeven, L., & Valencia, F. (2020). Systemic banking crises database II. IMF Economic Review, 68(2), 307-361. https://doi.org/10.1057/s41308-020-00107-3
Laeven, L., & Valencia, F. (2026). Systemic banking crises database: 1970-2025 (IMF Working Paper No. WP/26/94). International Monetary Fund.
Laibson, D. (1997). Golden eggs and hyperbolic discounting. Quarterly Journal of Economics, 112(2), 443-478. https://doi.org/10.1162/003355397555253
Latour, B. (1986). The powers of association. In J. Law (Ed.), Power, action and belief (pp. 264-280). Routledge & Kegan Paul.
Latour, B. (1987). Science in action: How to follow scientists and engineers through society. Harvard University Press.
Latour, B. (1992). Where are the missing masses? The sociology of a few mundane artifacts. In W. E. Bijker & J. Law (Eds.), Shaping technology/building society (pp. 225-258). MIT Press.
Latour, B. (1993). We have never been modern (C. Porter, Trans.). Harvard University Press.
Latour, B. (1999). Pandora’s hope. Harvard University Press.
Latour, B. (2004). Why has critique run out of steam? From matters of fact to matters of concern. Critical Inquiry, 30(2), 225-248. https://doi.org/10.1086/421123
Latour, B. (2005). Reassembling the social. Oxford University Press. https://doi.org/10.1093/oso/9780199256044.001.0001
Law, J. (1992). Notes on the theory of the actor-network: Ordering, strategy, and heterogeneity. Systems Practice, 5(4), 379-393. https://doi.org/10.1007/BF01059830
Lawrence, M., Homer-Dixon, T., Janzwood, S., Rockström, J., Renn, O., & Donges, J. F. (2024). Global polycrisis: The causal mechanisms of crisis entanglement. Global Sustainability, 7, Article e6. https://doi.org/10.1017/sus.2024.1
Leike, J. (2024, May 17). [Statement on resigning from OpenAI] [Post]. X.
Levin, K., Cashore, B., Bernstein, S., & Auld, G. (2012). Overcoming the tragedy of super wicked problems: Constraining our future selves to ameliorate global climate change. Policy Sciences, 45(2), 123-152. https://doi.org/10.1007/s11077-012-9151-0
Liebert, W., & Schmidt, J. C. (2010). Collingridge’s dilemma and technoscience. Poiesis & Praxis, 7(1-2), 55-71. https://doi.org/10.1007/s10202-010-0078-2
Lliuya v. RWE AG, 5 U 15/17 (Oberlandesgericht Hamm May 28, 2025).
Lohmann, S. (1994). The dynamics of informational cascades: The Monday demonstrations in Leipzig, East Germany, 1989-91. World Politics, 47(1), 42-101. https://doi.org/10.2307/2950679
Luca, M., Malhotra, D., & Poliquin, C. (2020). The impact of mass shootings on gun policy. Journal of Public Economics, 181, Article 104083. https://doi.org/10.1016/j.jpubeco.2019.104083
Lukács, G. (1971). History and class consciousness (R. Livingstone, Trans.). MIT Press. (Original work published 1923)
MacKenzie, D. (2006). An engine, not a camera: How financial models shape markets. MIT Press. https://doi.org/10.7551/mitpress/9780262134606.001.0001
Matthes, J., Knoll, J., & von Sikorski, C. (2018). The “spiral of silence” revisited: A meta-analysis on the relationship between perceptions of opinion support and political opinion expression. Communication Research, 45(1), 3-33. https://doi.org/10.1177/0093650217745429
Merton, R. K. (1936). The unanticipated consequences of purposive social action. American Sociological Review, 1(6), 894-904. https://doi.org/10.2307/2084615
Messeri, L., & Crockett, M. J. (2024). Artificial intelligence and illusions of understanding in scientific research. Nature, 627(8002), 49-58. https://doi.org/10.1038/s41586-024-07146-0
Mildenberger, M., & Sahn, A. (2025). The effect of policy traceability on legislative incentives. Legislative Studies Quarterly, 50(4), Article e70036. https://doi.org/10.1111/lsq.70036
Milkoreit, M. (2023). Social tipping points everywhere? Patterns and risks of overuse. WIREs Climate Change, 14(2), Article e813. https://doi.org/10.1002/wcc.813
Miller, R. A. (1974). Are familists amoral? A test of Banfield’s amoral familism hypothesis in a South Italian village. American Ethnologist, 1(3), 515-535. https://doi.org/10.1525/ae.1974.1.3.02a00080
Minsky, H. P. (1992). The financial instability hypothesis (Working Paper No. 74). Levy Economics Institute of Bard College. https://www.levyinstitute.org/pubs/wp74.pdf
Moore, F. C., Obradovich, N., Lehner, F., & Baylis, P. (2019). Rapidly declining remarkability of temperature anomalies may obscure public perception of climate change. Proceedings of the National Academy of Sciences, 116(11), 4905-4910. https://doi.org/10.1073/pnas.1816541116
Moreno-Mayar, J. V., Sousa da Mota, B., Higham, T., Klemm, S., Gorman Edmunds, M., Stenderup, J., Iraeta-Orbegozo, M., Laborde, V., Heyer, E., Torres Hochstetter, F., Friess, M., Allentoft, M. E., Schroeder, H., Delaneau, O., & Malaspinas, A.-S. (2024). Ancient Rapanui genomes reveal resilience and pre-European contact with the Americas. Nature, 633(8029), 389-397. https://doi.org/10.1038/s41586-024-07881-4
Morozov, E. (2012). The Collingridge dilemma [Response to the 2012 Edge question]. Edge. https://edge.org/response-detail/10898
NOAA Climate Prediction Center. (2026, September 10). ENSO diagnostic discussion. National Oceanic and Atmospheric Administration. https://www.cpc.ncep.noaa.gov/products/analysis_monitoring/enso_advisory/ensodisc.shtml
Noelle-Neumann, E. (1974). The spiral of silence: A theory of public opinion. Journal of Communication, 24(2), 43-51. https://doi.org/10.1111/j.1460-2466.1974.tb00367.x
Nohrstedt, D., Mazzoleni, M., Parker, C. F., & Di Baldassarre, G. (2021). Exposure to natural hazard events unassociated with policy change for improved disaster risk reduction. Nature Communications, 12, Article 193. https://doi.org/10.1038/s41467-020-20435-2
Norgaard, K. M. (2011). Living in denial: Climate change, emotions, and everyday life. MIT Press. https://doi.org/10.7551/mitpress/9780262015448.001.0001
Oliver, P. E., & Marwell, G. (1988). The paradox of group size in collective action: A theory of the critical mass. II. American Sociological Review, 53(1), 1-8. https://doi.org/10.2307/2095728
Olson, M. (1965). The logic of collective action: Public goods and the theory of groups. Harvard University Press.
Olson, M. (1982). The rise and decline of nations: Economic growth, stagflation, and social rigidities. Yale University Press.
Oreskes, N., & Conway, E. M. (2010). Merchants of doubt: How a handful of scientists obscured the truth on issues from tobacco smoke to global warming. Bloomsbury Press.
Ostrom, E. (1990). Governing the commons: The evolution of institutions for collective action. Cambridge University Press. https://doi.org/10.1017/CBO9780511807763
Ostrom, E. (2010). Beyond markets and states: Polycentric governance of complex economic systems. American Economic Review, 100(3), 641-672. https://doi.org/10.1257/aer.100.3.641
Otto, I. M., Donges, J. F., Cremades, R., Bhowmik, A., Hewitt, R. J., Lucht, W., Rockström, J., Allerberger, F., McCaffrey, M., Doe, S. S. P., Lenferna, A., Morán, N., van Vuuren, D. P., & Schellnhuber, H. J. (2020). Social tipping dynamics for stabilizing Earth’s climate by 2050. Proceedings of the National Academy of Sciences, 117(5), 2354-2365. https://doi.org/10.1073/pnas.1900577117
Papakonstantinou, T., Flecke, S. L., Edmunds, C. E. R., Cross, R., Tran, A., & Gold, N. (2025). A systematic review and meta-analysis of the effectiveness of social norms messaging approaches for improving health behaviours in developed countries. Nature Human Behaviour, 9(12), 2632-2650. https://doi.org/10.1038/s41562-025-02275-6
Parasuraman, R., & Manzey, D. H. (2010). Complacency and bias in human use of automation: An attentional integration. Human Factors, 52(3), 381-410. https://doi.org/10.1177/0018720810376055
Pauly, D. (1995). Anecdotes and the shifting baseline syndrome of fisheries. Trends in Ecology & Evolution, 10(10), 430. https://doi.org/10.1016/S0169-5347(00)89171-5
Penny, D., Hall, T., Evans, D., & Polkinghorne, M. (2019). Geoarchaeological evidence from Angkor, Cambodia, reveals a gradual decline rather than a catastrophic 15th-century collapse. Proceedings of the National Academy of Sciences, 116(11), 4871-4876. https://doi.org/10.1073/pnas.1821460116
Perdomo, J., Zrnic, T., Mendler-Dünner, C., & Hardt, M. (2020). Performative prediction. Proceedings of the 37th International Conference on Machine Learning, PMLR 119, 7599-7609. https://proceedings.mlr.press/v119/perdomo20a.html
Peters, B. G. (2017). What is so wicked about wicked problems? A conceptual analysis and a research program. Policy and Society, 36(3), 385-396. https://doi.org/10.1080/14494035.2017.1361633
Pew Research Center. (2025, April 3). How the U.S. public and AI experts view artificial intelligence. https://www.pewresearch.org/internet/2025/04/03/how-the-us-public-and-ai-experts-view-artificial-intelligence/
Pierson, P. (1993). When effect becomes cause: Policy feedback and political change. World Politics, 45(4), 595-628. https://doi.org/10.2307/2950710
Pierson, P. (2000). Increasing returns, path dependence, and the study of politics. American Political Science Review, 94(2), 251-267. https://doi.org/10.2307/2586011
Platt, J. (1973). Social traps. American Psychologist, 28(8), 641-651. https://doi.org/10.1037/h0035723
Putnam, R. D. (2000). Bowling alone: The collapse and revival of American community. Simon & Schuster.
Rayner, J., & Howlett, M. (2009). Introduction: Understanding integrated policy strategies and their evolution. Policy and Society, 28(2), 99-109. https://doi.org/10.1016/j.polsoc.2009.05.001
Riris, P., Silva, F., Crema, E., Palmisano, A., Robinson, E., Siegel, P. E., French, J. C., Jørgensen, E. K., Maezumi, S. Y., Solheim, S., Bates, J., Davies, B., Oh, Y., & Ren, X. (2024). Frequent disturbances enhanced the resilience of past human populations. Nature, 629(8013), 837-842. https://doi.org/10.1038/s41586-024-07354-8
Rittel, H. W. J., & Webber, M. M. (1973). Dilemmas in a general theory of planning. Policy Sciences, 4(2), 155-169. https://doi.org/10.1007/BF01405730
Rubin, O. (2008). The Malawi 2002 famine: Destitution, democracy and donors. Nordic Journal of African Studies, 17(1), 47-65. https://doi.org/10.53228/njas.v17i1.247
Rubin, O. (2009). The merits of democracy in famine protection: Fact or fallacy? European Journal of Development Research, 21(5), 699-717. https://doi.org/10.1057/ejdr.2009.37
Samuelson, W., & Zeckhauser, R. (1988). Status quo bias in decision making. Journal of Risk and Uncertainty, 1(1), 7-59. https://doi.org/10.1007/BF00055564
Schölkopf, B., Locatello, F., Bauer, S., Ke, N. R., Kalchbrenner, N., Goyal, A., & Bengio, Y. (2021). Toward causal representation learning. Proceedings of the IEEE, 109(5), 612-634. https://doi.org/10.1109/JPROC.2021.3058954
Sculley, D., Holt, G., Golovin, D., Davydov, E., Phillips, T., Ebner, D., Chaudhary, V., Young, M., Crespo, J.-F., & Dennison, D. (2015). Hidden technical debt in machine learning systems. Advances in Neural Information Processing Systems, 28, 2503-2511.
Seager, R., Cane, M., Henderson, N., Lee, D.-E., Abernathey, R., & Zhang, H. (2019). Strengthening tropical Pacific zonal sea surface temperature gradient consistent with rising greenhouse gases. Nature Climate Change, 9(7), 517-522. https://doi.org/10.1038/s41558-019-0505-x
Senge, P. M. (1990). The fifth discipline: The art and practice of the learning organization. Doubleday/Currency.
Søgaard Jørgensen, P., Jansen, R. E. V., Avila Ortega, D. I., Wang-Erlandsson, L., Donges, J. F., Österblom, H., Olsson, P., Nyström, M., Lade, S. J., Hahn, T., Folke, C., Peterson, G. D., & Crépin, A.-S. (2024). Evolution of the polycrisis: Anthropocene traps that challenge global sustainability. Philosophical Transactions of the Royal Society B: Biological Sciences, 379(1893), Article 20220261. https://doi.org/10.1098/rstb.2022.0261
Shen, J. H., & Tamkin, A. (2026). How AI impacts skill formation (arXiv:2601.20245). arXiv. https://arxiv.org/abs/2601.20245
Smith, S. R., Christie, I., & Willis, R. (2020). Social tipping intervention strategies for rapid decarbonization need to consider how change happens. Proceedings of the National Academy of Sciences, 117(20), 10629-10630. https://doi.org/10.1073/pnas.2002331117
Sparkman, G., Geiger, N., & Weber, E. U. (2022). Americans experience a false social reality by underestimating popular climate policy support by nearly half. Nature Communications, 13, Article 4779. https://doi.org/10.1038/s41467-022-32412-y
Star, S. L. (1999). The ethnography of infrastructure. American Behavioral Scientist, 43(3), 377-391. https://doi.org/10.1177/00027649921955326
Star, S. L., & Ruhleder, K. (1996). Steps toward an ecology of infrastructure: Design and access for large information spaces. Information Systems Research, 7(1), 111-134. https://doi.org/10.1287/isre.7.1.111
Streeck, W., & Thelen, K. (Eds.). (2005). Beyond continuity: Institutional change in advanced political economies. Oxford University Press. https://doi.org/10.1093/oso/9780199280452.001.0001
Stuart-Smith, R. F., Otto, F. E. L., Saad, A. I., Lisi, G., Minnerop, P., Lauta, K. C., van Zwieten, K., & Wetzer, T. (2021). Filling the evidentiary gap in climate litigation. Nature Climate Change, 11(8), 651-655. https://doi.org/10.1038/s41558-021-01086-7
Sunstein, C. R. (2007). Of Montreal and Kyoto: A tale of two protocols. Harvard Environmental Law Review, 31, 1.
Tainter, J. A. (1988). The collapse of complex societies. Cambridge University Press.
Terhaar, J., Vogt, L., & Foukal, N. P. (2025). Atlantic overturning inferred from air-sea heat fluxes indicates no decline since the 1960s. Nature Communications, 16, Article 222. https://doi.org/10.1038/s41467-024-55297-5
Tett, G. (2015). The silo effect: The peril of expertise and the promise of breaking down barriers. Simon & Schuster.
Tiede, K. E., Maur, K., & Betsch, C. (2026). People systematically under- and overestimate public engagement in climate action. Nature Climate Change, 16(7), 774-780. https://doi.org/10.1038/s41558-026-02668-z
UK Parliament. (2025, February 24). [Written statement on renaming the AI Safety Institute as the AI Security Institute] (HLWS454). https://questions-statements.parliament.uk/written-statements/1777343
Unruh, G. C. (2000). Understanding carbon lock-in. Energy Policy, 28(12), 817-830. https://doi.org/10.1016/S0301-4215(00)00070-7
US Department of Commerce. (2025, June 3). [Statement by Secretary Howard Lutnick on reorganising the US AI Safety Institute as the Center for AI Standards and Innovation] [Press release]. https://www.commerce.gov/node/7172
US Senate Committee on Commerce, Science, and Transportation. (2025, July 1). Senate strikes AI moratorium from budget reconciliation bill in overwhelming 99-1 vote [Press release]. https://www.commerce.senate.gov/index.php/2025/7/senate-strikes-ai-moratorium-from-budget-reconciliation-bill-in-overwhelming-99-1-vote/8415a728-fd1d-4269-98ac-101d1d0c71e0
Uslaner, E. M. (2002). The moral foundations of trust. Cambridge University Press. https://doi.org/10.1017/CBO9780511614934
van Bavel, B., Curtis, D. R., & Soens, T. (2018). Economic inequality and institutional adaptation in response to flood hazards: A historical analysis. Ecology and Society, 23(4), Article 30. https://doi.org/10.5751/ES-10491-230430
van Westen, R. M., Börner, R., & Dijkstra, H. A. (2026). Failure to track a stable AMOC state under rapid climate change. Nature Climate Change, 16(10), 1195-1206. https://doi.org/10.1038/s41558-026-02730-w
Vance, J. D. (2025, February 11). [Remarks at the Artificial Intelligence Action Summit, Paris] [Speech transcript]. US Embassy in France.
Vaughan, D. (1996). The Challenger launch decision: Risky technology, culture, and deviance at NASA. University of Chicago Press.
Watkins, M. D., & Bazerman, M. H. (2003). Predictable surprises: The disasters you should have seen coming. Harvard Business Review, 81(3), 72-80.
Watts, D. J. (2002). A simple model of global cascades on random networks. Proceedings of the National Academy of Sciences, 99(9), 5766-5771. https://doi.org/10.1073/pnas.082090499
Weber, E. U. (2006). Experience-based and description-based perceptions of long-term risk: Why global warming does not scare us (yet). Climatic Change, 77(1-2), 103-120. https://doi.org/10.1007/s10584-006-9060-3
Wiener, J. B. (2003). Managing the iatrogenic risks of risk management. In Office of Management and Budget, Informing regulatory decisions: 2003 report to Congress. (Reprinted from RISK: Health, Safety & Environment, 9(1), 39-82, 1998)
Wildavsky, A. (1979). Speaking truth to power: The art and craft of policy analysis. Little, Brown.
Will, P.-E., & Wong, R. B. (1991). Nourish the people: The state civilian granary system in China, 1650-1850. Center for Chinese Studies, University of Michigan. https://doi.org/10.3998/mpub.19044
World Meteorological Organization. (2026a). State of the global climate 2025 (WMO-No. 1391).
World Meteorological Organization. (2026b, September 3). El Niño/La Niña update. https://wmo.int/news/media-centre/el-nino-set-become-very-strong-raising-risks-of-extreme-weather-2027
Wucker, M. (2016). The gray rhino: How to recognize and act on the obvious dangers we ignore. St. Martin’s Press.
Xie, J., Sreenivasan, S., Korniss, G., Zhang, W., Lim, C., & Szymanski, B. K. (2011). Social consensus through the influence of committed minorities. Physical Review E, 84(1), Article 011130. https://doi.org/10.1103/PhysRevE.84.011130
Zečević, M., Willig, M., Dhami, D. S., & Kersting, K. (2023). Causal parrots: Large language models may talk causality but are not causal. Transactions on Machine Learning Research. https://arxiv.org/abs/2308.13067
Zheng, X., Aragam, B., Ravikumar, P., & Xing, E. P. (2018). DAGs with NO TEARS: Continuous optimization for structure learning. Advances in Neural Information Processing Systems, 31, 9472-9483.
-
The calibration combines measures of different things (willingness to pay and protest participation), so the numbers carry more precision than the evidence supports. Treat them as orders of magnitude. ↩