
TL;DR
-
Technology adoption follows predictable mathematical patterns across generations, with adoption speeds accelerating from telegraph (56 years to 50% penetration) through AI tools (3 years to 50% penetration), demonstrating consistent temporal compression in innovation cycles
-
S-curve investment relationships operate through dynamic feedback loops where early adoption signals market viability and drives subsequent investment waves, with AI representing the most compressed adoption-investment cycle in technological history reaching $131.5 billion in 2024
-
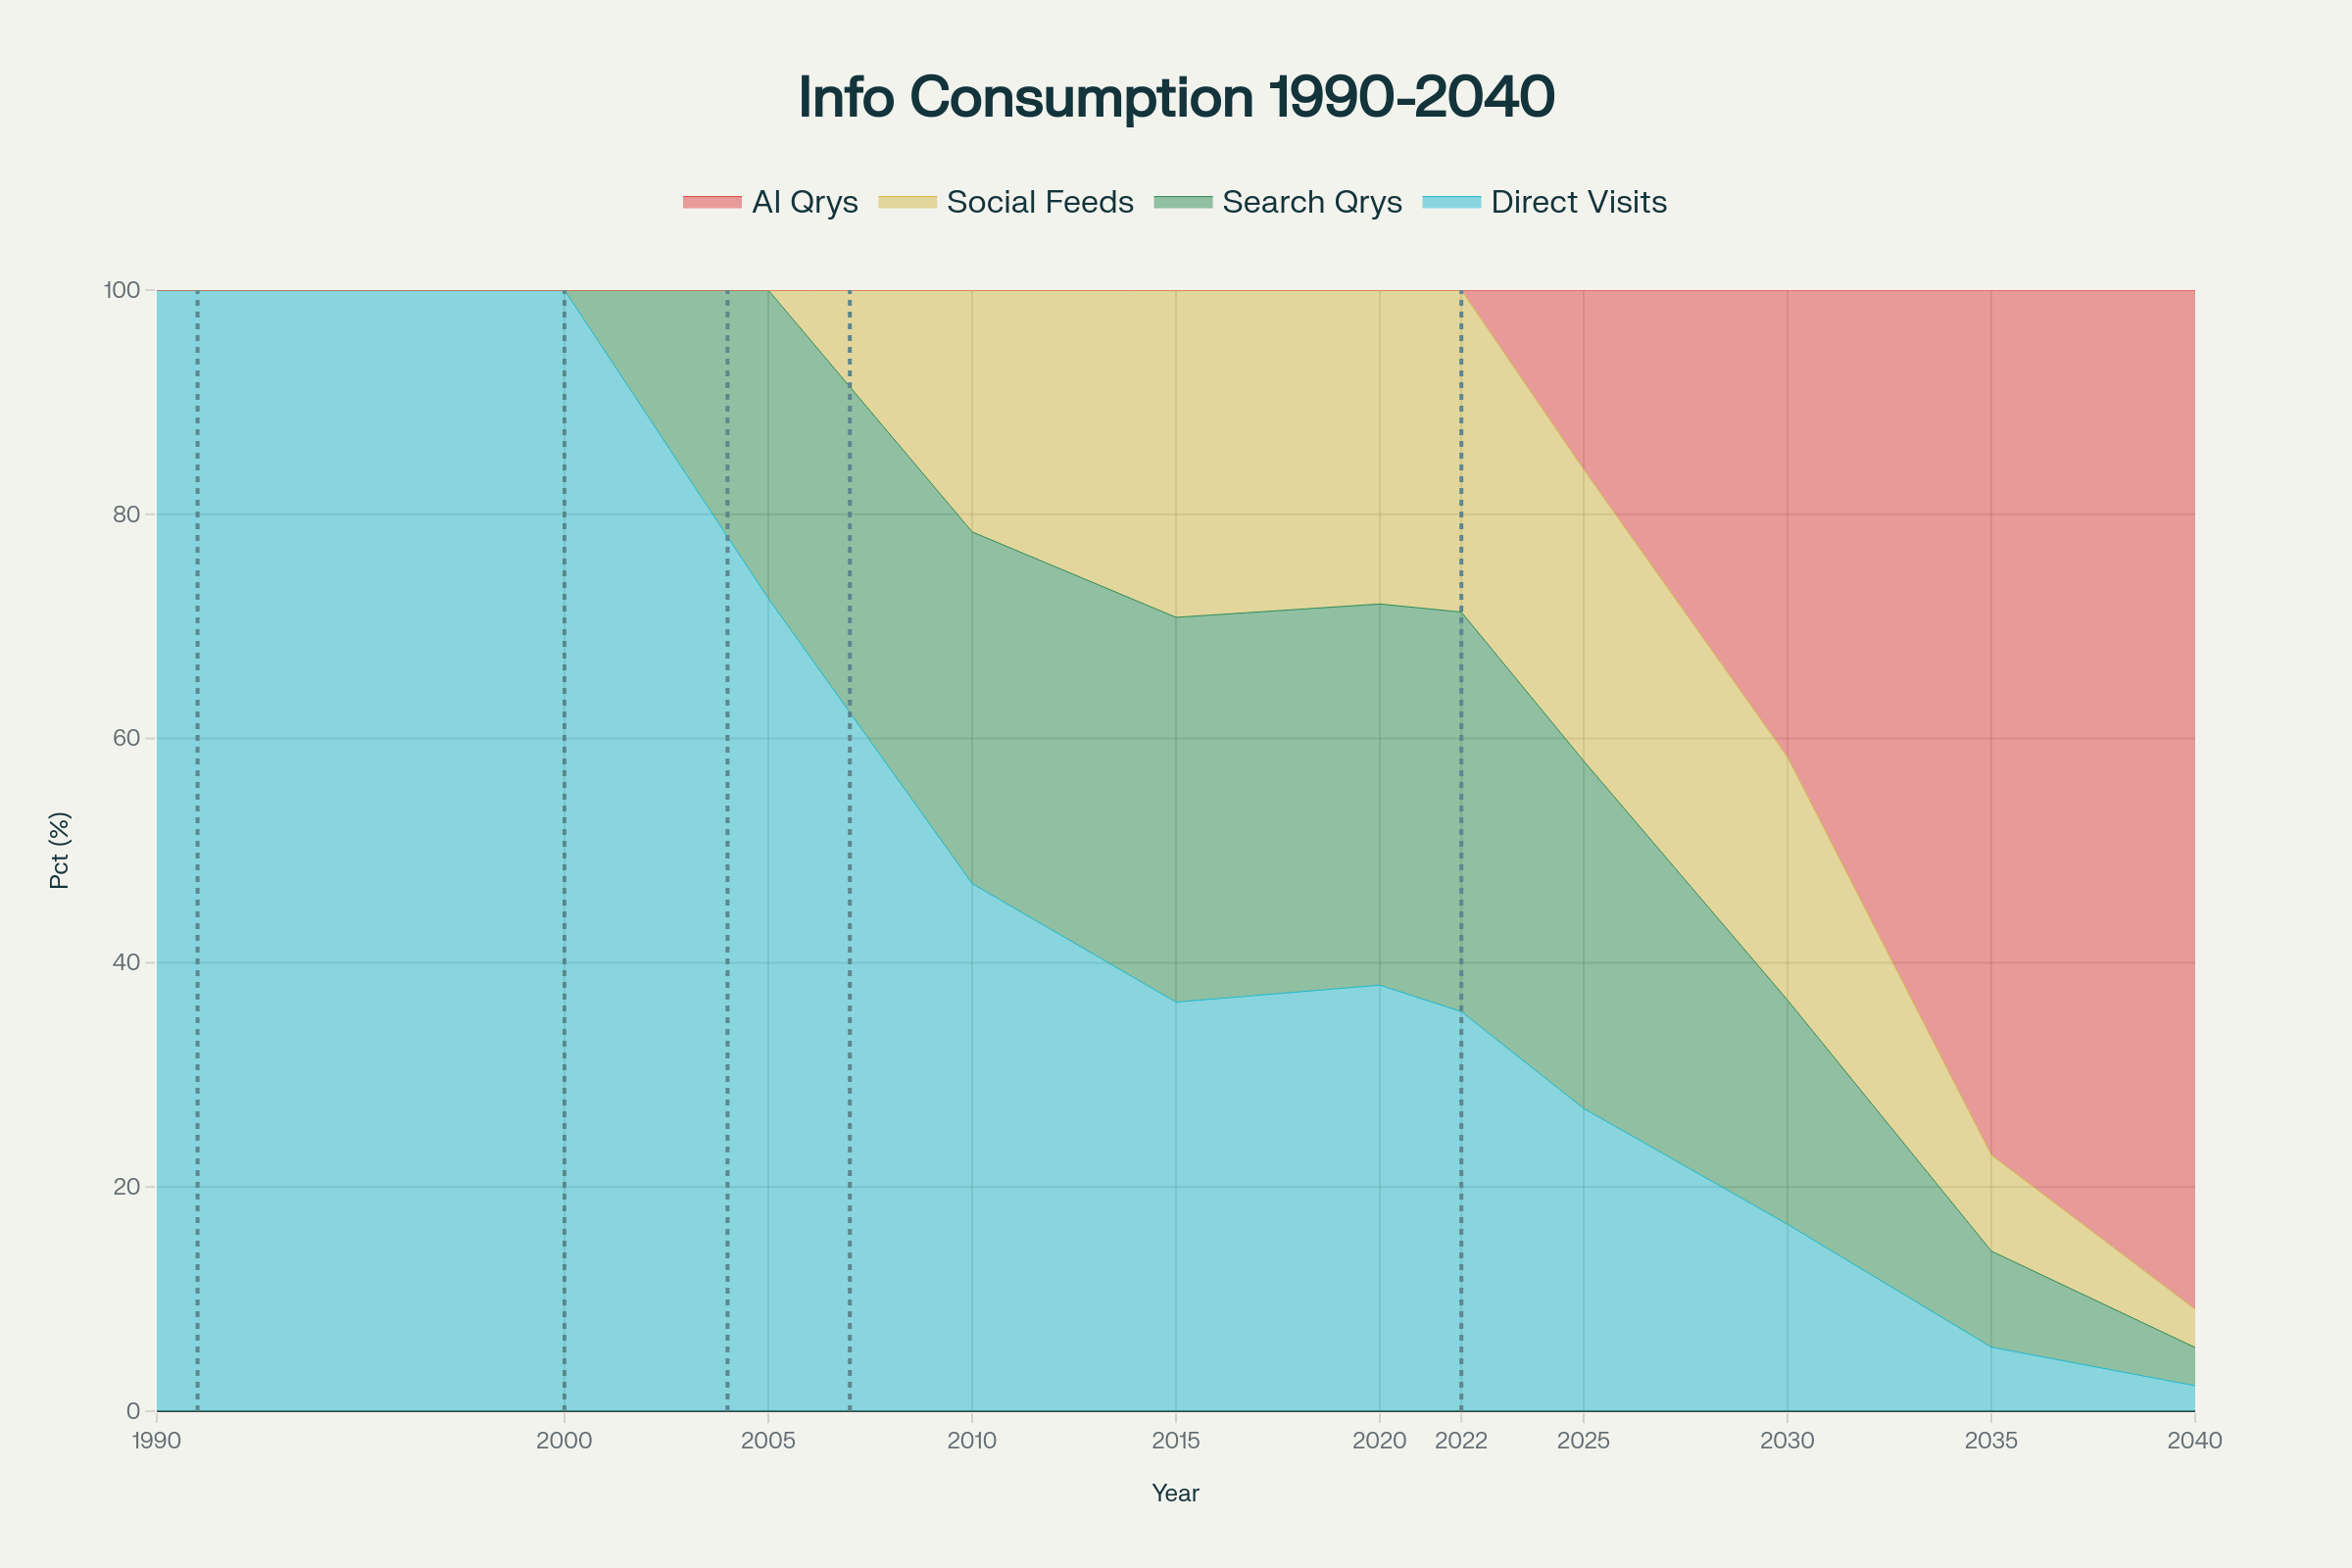
Information consumption undergoes fundamental transformation from website-based access patterns to AI-native interfaces, with traditional search engines declining from 47.4% to projected 5.9% market share by 2040 while AI assistants capture 77% of information queries
-
Traditional website platforms face existential challenges as AI-generated websites project to capture 40% of new site creation by 2030, forcing fundamental architectural shifts toward API-first development and headless content management systems
-
Mathematical modeling using Bass Diffusion principles reveals AI adoption parameters with innovation coefficient p=0.01 and imitation coefficient q=0.8 that exceed historical technology adoption speeds through enhanced network effects and infrastructure leverage
-
Presentation layer evolution toward headless architectures reflects interface fragmentation across eight distinct paradigms, making traditional website presentation layers economically unsustainable as content consumption shifts to conversational AI, voice assistants, and specialized applications by 2040
The Mathematical Architecture of Technological Change
Technology adoption patterns reveal consistent mathematical relationships that span centuries of innovation. From telegraph systems requiring Congressional funding in 1844 to AI tools achieving global penetration within months, technological change follows predictable S-curve progressions while simultaneously exhibiting accelerating adoption cycles that compress historical timelines from decades to years.
These patterns emerge through two complementary but distinct mathematical frameworks. Technology adoption curves describe how different population segments embrace innovations over time, following sociological patterns first identified by Everett Rogers in 1962. Technology progression S-curves chart performance improvements relative to research investment, revealing the technical maturation process that underlies market readiness.
Understanding both frameworks provides strategic insight into current AI transformation. Mathematical modeling demonstrates that artificial intelligence represents both the fastest technology adoption in recorded history and the most compressed adoption-investment feedback cycle. This dual acceleration creates unprecedented challenges for organizations navigating digital transformation while simultaneously offering competitive advantages for those who understand the underlying mathematical principles.
S-Curves and Technology Adoption: Mathematical Foundations of Innovation Diffusion
The Fundamental Mathematics of Adoption
Technology adoption follows predictable mathematical patterns characterized by slow initial uptake, rapid acceleration during mainstream adoption, and eventual saturation as markets reach capacity. The S-curve model captures this progression through logistic growth equations that prove remarkably consistent across diverse technological transitions spanning two centuries.
The fundamental S-curve equation y = L/(1 + e^(-k(x-x₀))) reveals three critical parameters. Market potential (L) represents theoretical maximum adoption levels. Growth rate (k) determines acceleration speed during the exponential phase. The inflection point (x₀) marks transition from early adoption to mainstream market penetration.
These mathematical relationships hold across technologies as diverse as telegraph systems, automobiles, smartphones, and artificial intelligence. Research demonstrates that adoption curves maintain consistent shapes despite varying timeframes, suggesting underlying mathematical principles govern technological diffusion regardless of specific innovation characteristics.
Rogers’ Adoption Curve: The Sociological Foundation
Rogers’ technology adoption curve categorizes users into five distinct segments forming bell-shaped distributions. Innovators represent 2.5% of populations and embrace new technologies despite high risk and uncertain outcomes. Early adopters comprise 13.5% and serve as opinion leaders whose endorsement influences broader market acceptance.
Early majority adopters account for 34% and approach innovations pragmatically after observing success among earlier groups. Late majority represents another 34% and adopts technologies with considerable skepticism, often due to social pressure rather than enthusiasm. Laggards constitute the final 16% and embrace innovations only when absolutely necessary.
This segmentation model demonstrates consistent patterns across technologies and cultures. Statistical analysis reveals adoption curves maintain similar proportional distributions whether examining historical telegraph adoption or contemporary AI tool penetration. The mathematical consistency suggests fundamental psychological and social factors drive technology adoption beyond specific product characteristics.
AI Technology Adoption: Unprecedented Acceleration
Artificial intelligence represents the fastest technology adoption in recorded history. ChatGPT achieved 100 million monthly active users within two months of launch, demonstrating adoption speeds that exceed smartphone penetration by significant margins. Current data shows AI tools achieving 50% adoption among knowledge workers within 36 months of availability, compared to smartphones requiring 60 months for similar penetration.
This acceleration reflects several mathematical factors. Digital infrastructure enables immediate global distribution without physical manufacturing constraints. Network effects amplify adoption incentives as each additional user improves AI model performance through data feedback. Reduced switching costs eliminate traditional barriers that slowed historical technology adoption.
Mathematical modeling using Bass Diffusion principles reveals AI adoption parameters that exceed historical precedent. Innovation coefficient p=0.01 reflects strong external promotion and marketing influence. Imitation coefficient q=0.8 captures powerful network effects that compound adoption incentives beyond historical technology patterns.
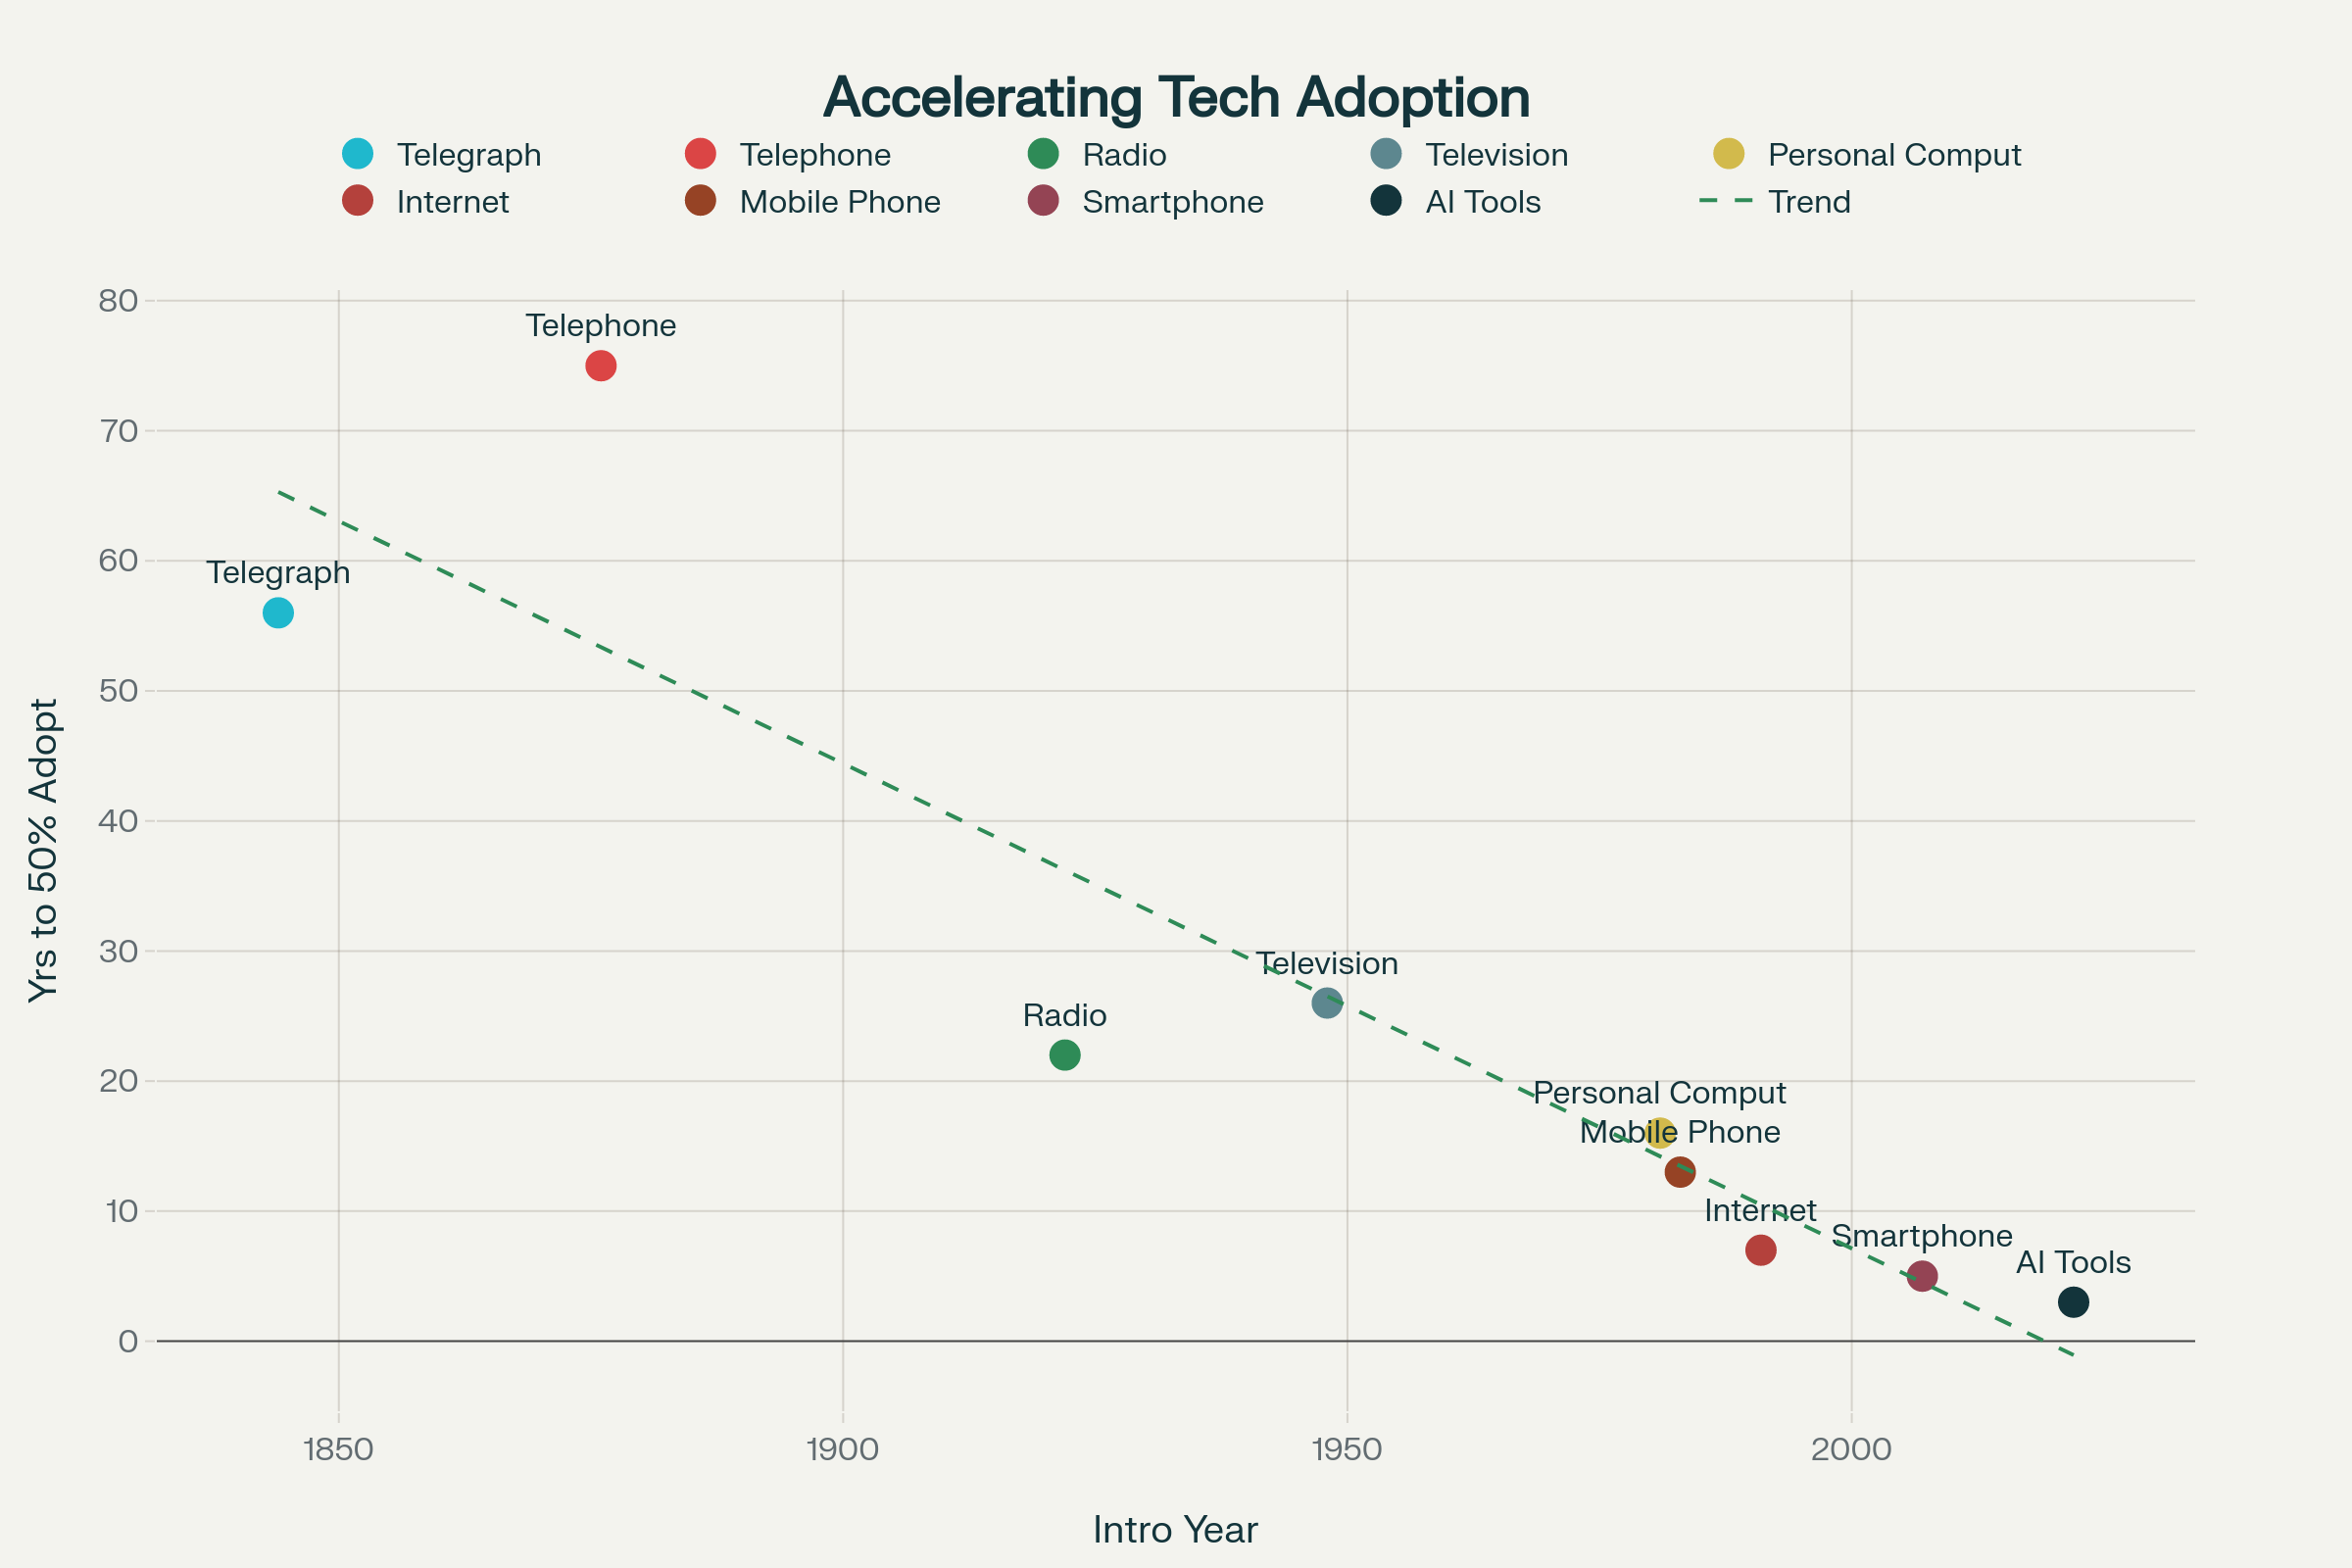
Technology adoption speeds demonstrate consistent acceleration across generations, with AI representing the fastest adoption in recorded history.
Comparative Historical Analysis: Accelerating Patterns
Technology adoption speeds demonstrate consistent acceleration across generations. Telegraph introduction in 1844 required 56 years to achieve 50% household adoption due to infrastructure development challenges and capital formation constraints. Radio technology achieved mainstream adoption in 22 years following 1922 commercial introduction by leveraging broadcast infrastructure advantages.
Personal computers compressed adoption timelines to 16 years from 1981 introduction, while Internet penetration required only 7 years following 1991 commercial launch. Smartphones continued acceleration patterns with 5-year adoption cycles after iPhone’s 2007 release. AI tools project to achieve 50% adoption in merely 3 years, representing the fastest technology adoption in recorded history.
This acceleration reflects cumulative advantages. Each technology generation builds upon existing infrastructure rather than requiring entirely new systems. Modern venture capital and corporate investment capabilities enable rapid deployment of massive resources once market signals appear. Digital connectivity eliminates geographic constraints that historically limited technology diffusion.
Bass Diffusion Model: Mathematical Prediction Framework
The Bass Diffusion Model provides quantitative framework for understanding adoption dynamics through equation f(t) = (p + qF(t))/(1 + qF(t)). Innovation coefficient (p) represents external influence from marketing and media. Imitation coefficient (q) captures internal network effects and word-of-mouth influence.
Historical technology analysis reveals consistent parameter ranges across innovations. Traditional technologies exhibit p values between 0.001-0.01 and q values between 0.1-0.5. AI adoption demonstrates exceptional parameters with p=0.01 and q=0.8, indicating both strong external promotion and unprecedented network effects.
These parameters enable mathematical prediction of adoption trajectories. Current modeling suggests AI will reach 77.3% of Internet users by 2030, representing completion of early majority adoption phase. The mathematical foundation provides strategic planning insights for organizations navigating AI transformation.
The Temporal Relationship: How Adoption Drives S-Curve Investment
Dynamic Feedback Loop Mechanisms
Temporal relationships between technology adoption curves and S-curve investment operate through dynamic feedback loops where early adoption signals market viability and drives subsequent investment waves. This relationship has remained consistent across technological transitions spanning telegraph networks through modern artificial intelligence systems.
Early adopters serve as proof-of-concept validators who demonstrate real-world utility and willingness to pay for new technologies. When innovators and early adopters embrace innovations, they provide crucial market signals that reduce uncertainty for investors. This triggers increased R&D investment and infrastructure development that accelerates subsequent adoption phases.
Mathematical analysis confirms that investment directly modifies adoption curve parameters. Higher investment levels lead to steeper growth rates, earlier inflection points, and larger market potentials. Research using time-varying parameter models demonstrates how sustained investment increases adoption rates and advances timing parameters throughout technological transitions.
Historical Technology Investment Patterns
Automobile Era Investment Acceleration (1900-1930)
Automobile transformation exemplifies adoption-investment feedback loops operating across extended timeframes. Early automobile adoption in the 1900s initially progressed slowly, with vehicles viewed as expensive novelties rather than practical transportation solutions. However, early adopter experiences demonstrated practical utility that triggered massive infrastructure investment.
Henry Ford’s assembly line introduction in 1908 demonstrates how early adoption success justified manufacturing innovations that further reduced costs and accelerated adoption. The $5-per-day wage Ford paid workers reflected expectation that higher wages would create more automobile customers, exemplifying adoption-investment feedback dynamics.
Infrastructure investment extended far beyond manufacturing to include road construction, gas stations, repair facilities, and supply chain development. This cascading investment pattern, initiated by early adoption signals, created foundations for twentieth-century transportation systems and urban development patterns.
Telegraph Communication Investment Cycles (1844-1860)
Telegraph transition provides clear examples of infrastructure investment driven by adoption demand. Samuel Morse’s initial demonstration line between Washington D.C. and Baltimore required Congressional funding of $30,000 in 1844, but early adoption quickly demonstrated commercial viability leading to substantial private investment.
Telegraph companies collectively spent estimated $315,000 replacing deficient wire in the first operational years, representing substantial first-mover penalties that ultimately benefited later technologies by creating established wire manufacturing industries and installation expertise. This investment created network effects where each new connection increased system value, driving continued infrastructure expansion.
Network effects demonstrate mathematical scaling benefits. Telegraph value increased exponentially with each additional connection point, creating compelling investment incentives that accelerated both technical development and geographic expansion. The U.S. achieved coast-to-coast telegraph coverage by 1861 through this investment acceleration.
AI Investment Acceleration: Unprecedented Scale
Artificial intelligence represents the most dramatic example of adoption-driven investment acceleration in technological history. AI investment grew from approximately $3 billion globally in 2014 to $131.5 billion in 2024, demonstrating unprecedented scaling of capital deployment in response to adoption signals.
Early AI adoption in search, recommendations, and automation demonstrated clear business value that triggered massive investment increases across venture capital, corporate R&D, and government funding. Generative AI investment alone reached $25.2 billion in 2023, representing eight-fold increase from 2022 levels following ChatGPT’s successful market penetration.
Federal AI R&D investment illustrates government response to adoption signals. Investment grew from $2.4 billion in 2021 to $3.3 billion requested for 2025, reflecting policy recognition of AI strategic importance. Private equity investment in data centers reached $18.15 billion in 2024, largely driven by AI computational demands that emerged from widespread adoption.
Mathematical Investment Threshold Analysis
Empirical analysis suggests minimum investment thresholds for adoption acceleration. Technologies typically require investment levels exceeding 1-2% of total addressable market size to achieve mainstream adoption curves. Historical analysis confirms this relationship across telegraph, automobile, and computing technologies.
AI has exceeded this threshold substantially. Current $131.5 billion investment represents approximately 20% of projected $632 billion AI market by 2028, indicating massive capital deployment that accelerates adoption beyond historical precedent. This investment intensity creates competitive advantages for organizations that understand mathematical relationships between investment and adoption acceleration.
Investment intensity comparisons reveal AI transformation scale. AI companies spend average $4.9 billion annually on R&D compared to $2.7 billion for non-AI companies. This represents 30-fold increase in investment intensity compared to early automobile or telegraph development when adjusted for inflation.
Information Consumption Evolution: From Websites to AI-Native Access
Four Distinct Eras of Digital Information Access
Web 1.0 Era (1990-2005): Foundation and Directory Navigation
Internet information consumption began with direct website navigation and emerging search functionality. Users primarily accessed information through direct website visits representing 80% of activity via bookmarks and typed URLs. Early search engines including Archie (1990), Yahoo! (1994), and AltaVista (1995) represented only 20% of information access.
Global Internet user base grew from 4.3 million in 1991 (0.1% penetration) to 1.024 billion by 2005, representing annual growth rate of 13.6%. Information consumption was overwhelmingly passive, with 90% of users consuming rather than creating content. This established patterns that influenced subsequent technological development and user behavior expectations.
Static, text-heavy pages with limited multimedia content characterized this era. Website design emphasized information presentation rather than user interaction. Directory-based navigation systems like Yahoo’s category structure reflected hierarchical information organization that users understood from library and encyclopedia systems.
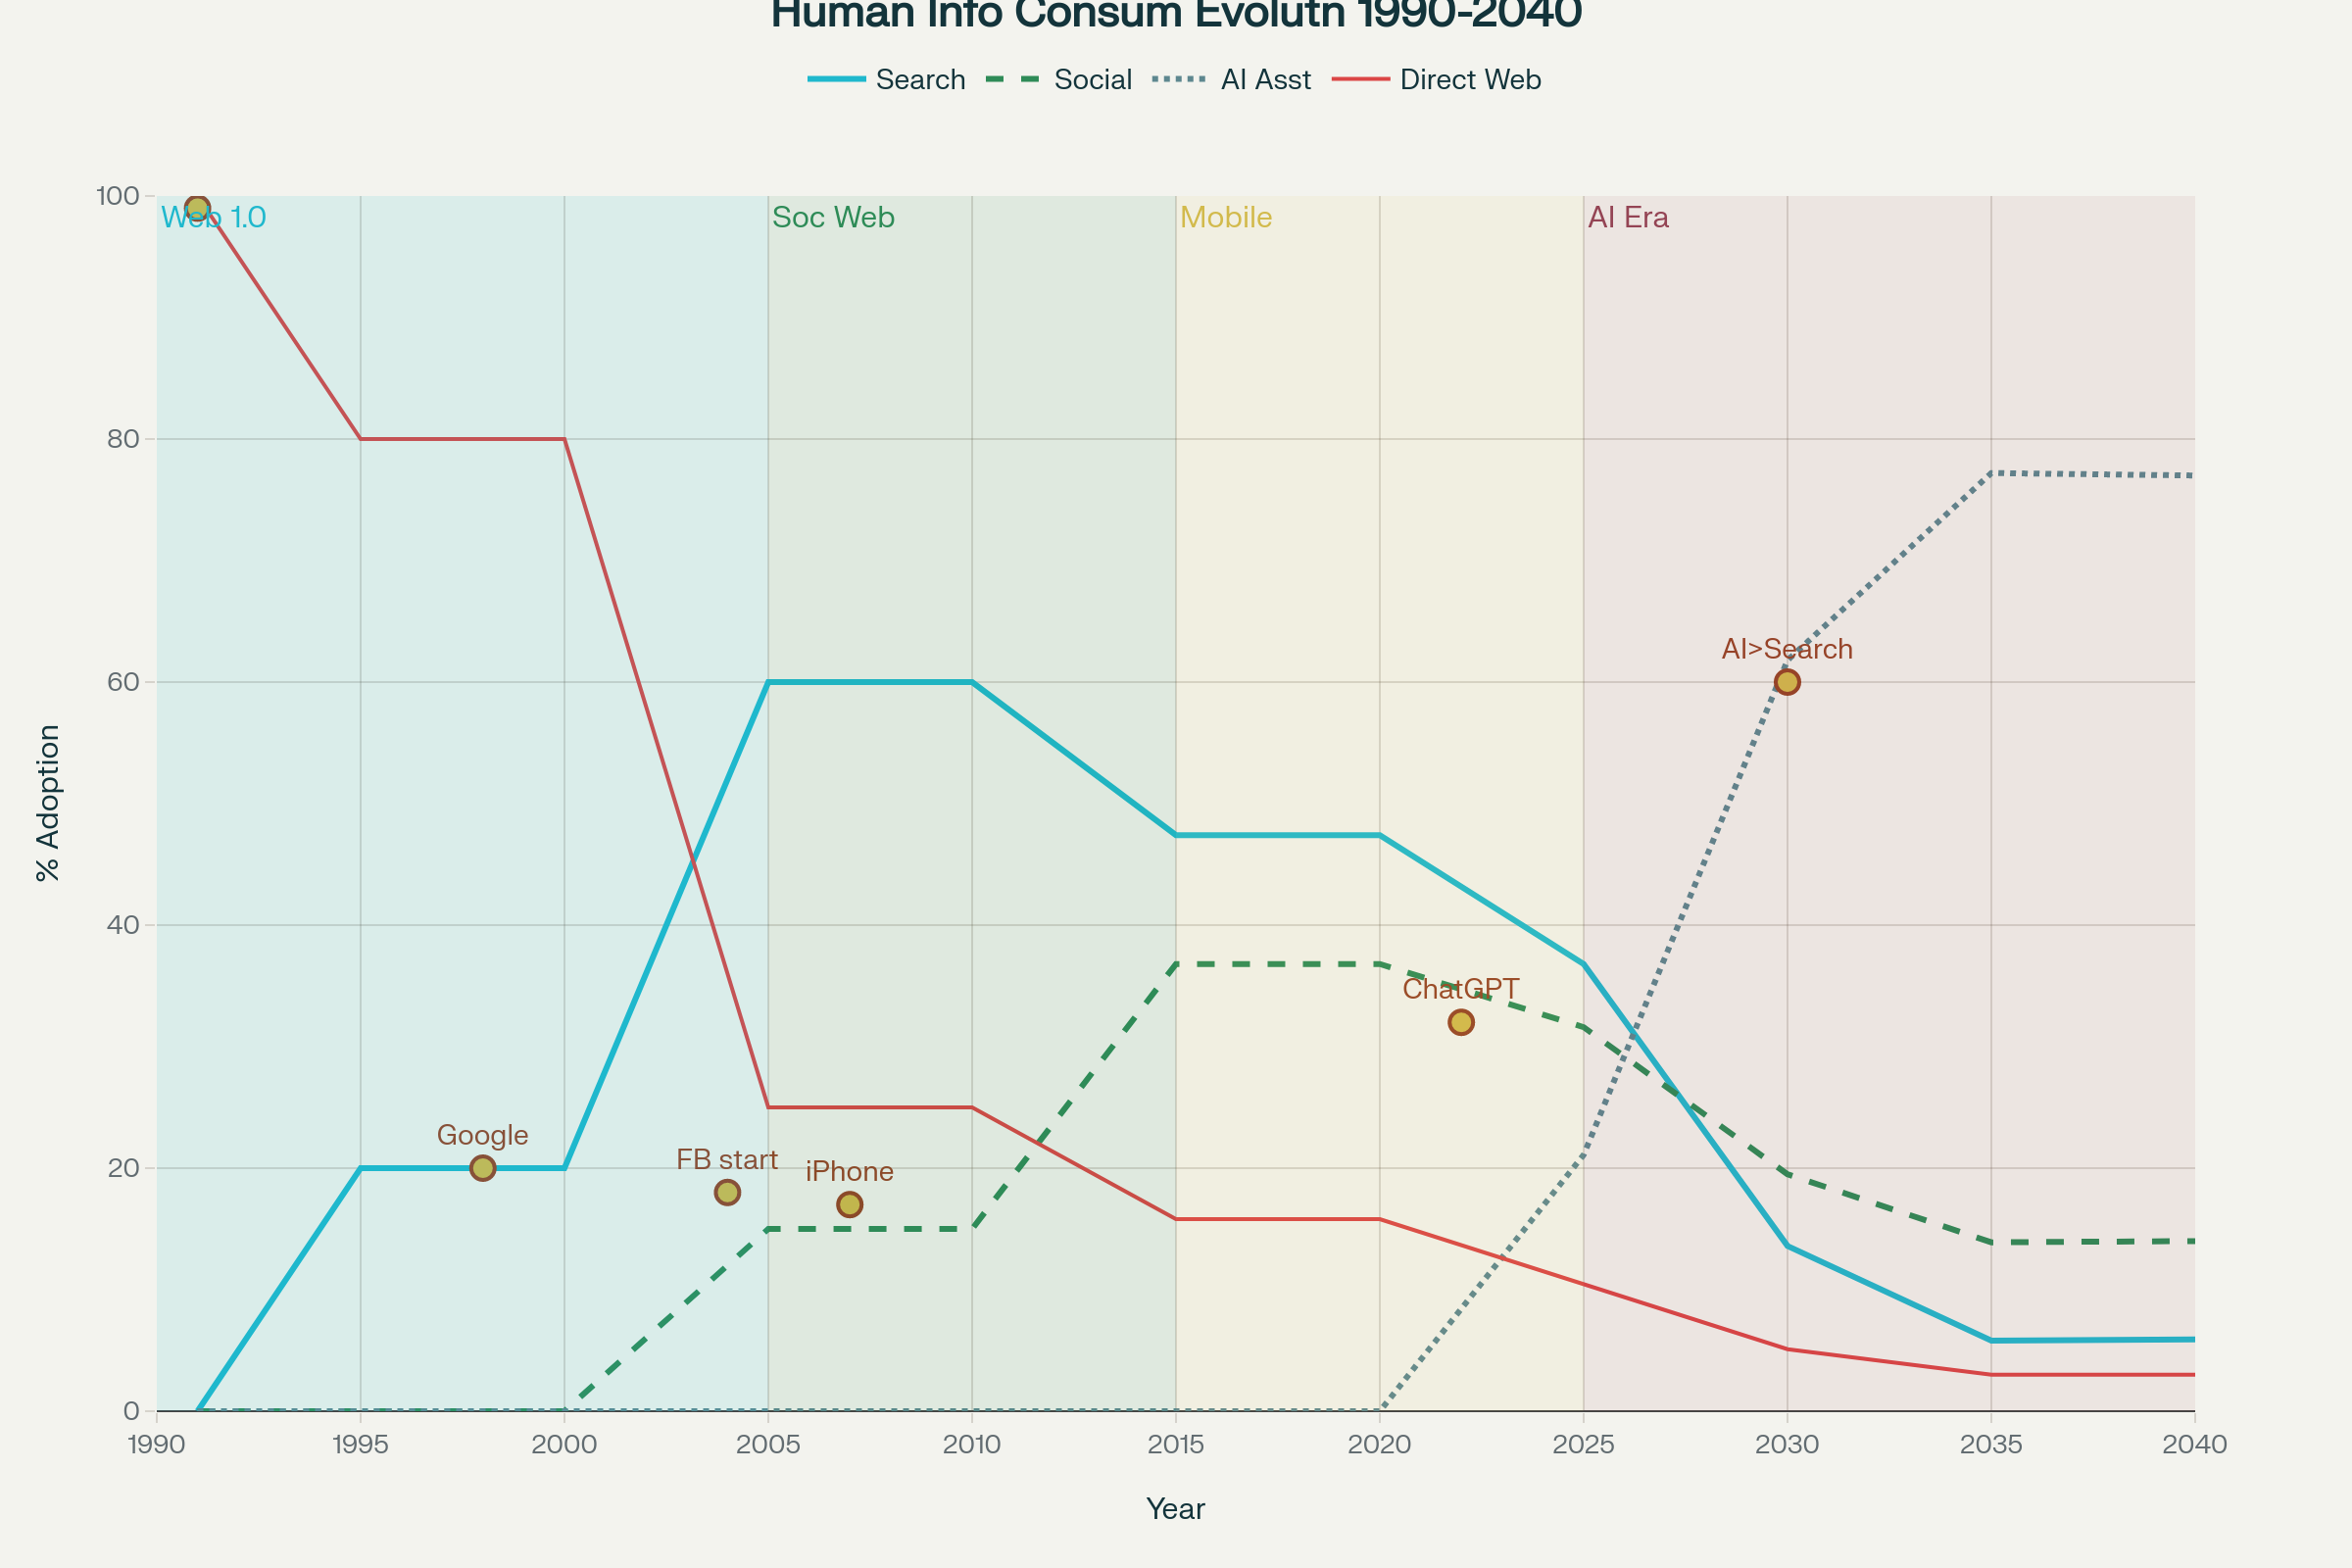
The transition from direct website navigation to search engines, social media, and ultimately AI assistants demonstrates predictable S-curve adoption patterns.
Social Web Era (2005-2015): Search Dominance and Platform Emergence
This period witnessed Google’s PageRank algorithm rise and social media platform emergence that began fragmenting information consumption patterns. Search engines achieved dominance with 47% of information access through superior ranking algorithms that improved relevance and user satisfaction.
Social media emerged with 15% of activity following Facebook’s 2004 launch and Twitter’s 2006 debut. User-generated content expansion enabled participatory information sharing that transformed Internet from publication medium to communication platform. Web 2.0 technologies enabled dynamic content creation and community formation.
Internet users expanded from 1.024 billion to 3.2 billion during this decade, with annual growth rate of 7.8% as adoption approached saturation in developed markets. Smartphone introduction in 2007 began transition toward mobile-first information consumption that would reshape subsequent adoption patterns and interface design requirements.
Information consumption evolution demonstrates four distinct eras leading to AI-native access patterns by 2040.
Mobile-First Era (2015-2025): Platform Diversification and Algorithm Curation
Smartphone revolution fundamentally altered information consumption patterns through device-level changes that enabled new interaction paradigms. Mobile traffic surpassed desktop, reaching 64% by 2025, while social media platforms peaked at approximately 37% of information access before beginning gradual decline toward AI-mediated consumption.
Algorithm-driven content curation became prevalent across platforms as machine learning capabilities improved personalization accuracy. Users increasingly received information through algorithmic feeds rather than actively searching for specific content. This prepared behavioral patterns for subsequent AI-mediated information access.
Internet users grew from 3.2 billion to 5.6 billion (68% global penetration) with annual growth rate of 2.9% as adoption approached saturation limits. Platform consolidation occurred as development costs favored larger organizations with substantial computational resources and user data access.
AI-Native Era (2025-2040): Mathematical Transformation Modeling
Using Bass Diffusion Model parameters derived from historical technology adoption patterns, mathematical analysis reveals AI adoption with innovation coefficient p=0.01 and imitation coefficient q=0.8, targeting market potential of 6.0 billion users. These parameters exceed traditional Internet adoption coefficients, reflecting enhanced network effects and reduced switching costs.
2025-2027: Integration Phase
AI assistants reach 21.1% of information queries by 2025, with traditional search engines declining from 47.4% to 36.8% market share. AI-curated content expands from 5% to 25% of consumption as personalization algorithms become sophisticated and user behavior adapts to conversational interfaces.
This phase demonstrates mathematical acceleration as early majority adoption begins. Users transition from experimental AI usage to routine reliance for information needs. Enterprise adoption accelerates as organizations recognize productivity benefits and competitive advantages from AI integration.
2028-2030: The Mathematical Tipping Point
AI assistants surpass traditional search engines around 2030, capturing 61.8% of queries as AI penetration reaches 77.3% of Internet users. Traditional search drops to 13.6% market share while AI curation becomes dominant at 73.2% of content. This represents definitive transition to AI-mediated information consumption.
Mathematical modeling indicates this tipping point follows predictable S-curve acceleration patterns. Network effects amplify adoption as AI systems improve through increased usage data. User behavior shifts from query-based searching to conversational interaction patterns that become self-reinforcing.
2031-2040: AI-Native Maturity
AI assistants stabilize at 77% of information access by 2040, with traditional search engines relegated to 5.9% of queries for specialized use cases. 89% of content becomes AI-curated through personalization algorithms. Mobile-first consumption reaches 80% saturation as voice and conversational interfaces mature.
This maturity phase reflects S-curve plateau characteristics where additional adoption occurs primarily through population growth rather than behavioral change among existing users. Technology performance stabilizes as fundamental technical limitations constrain further improvement without paradigm shifts.
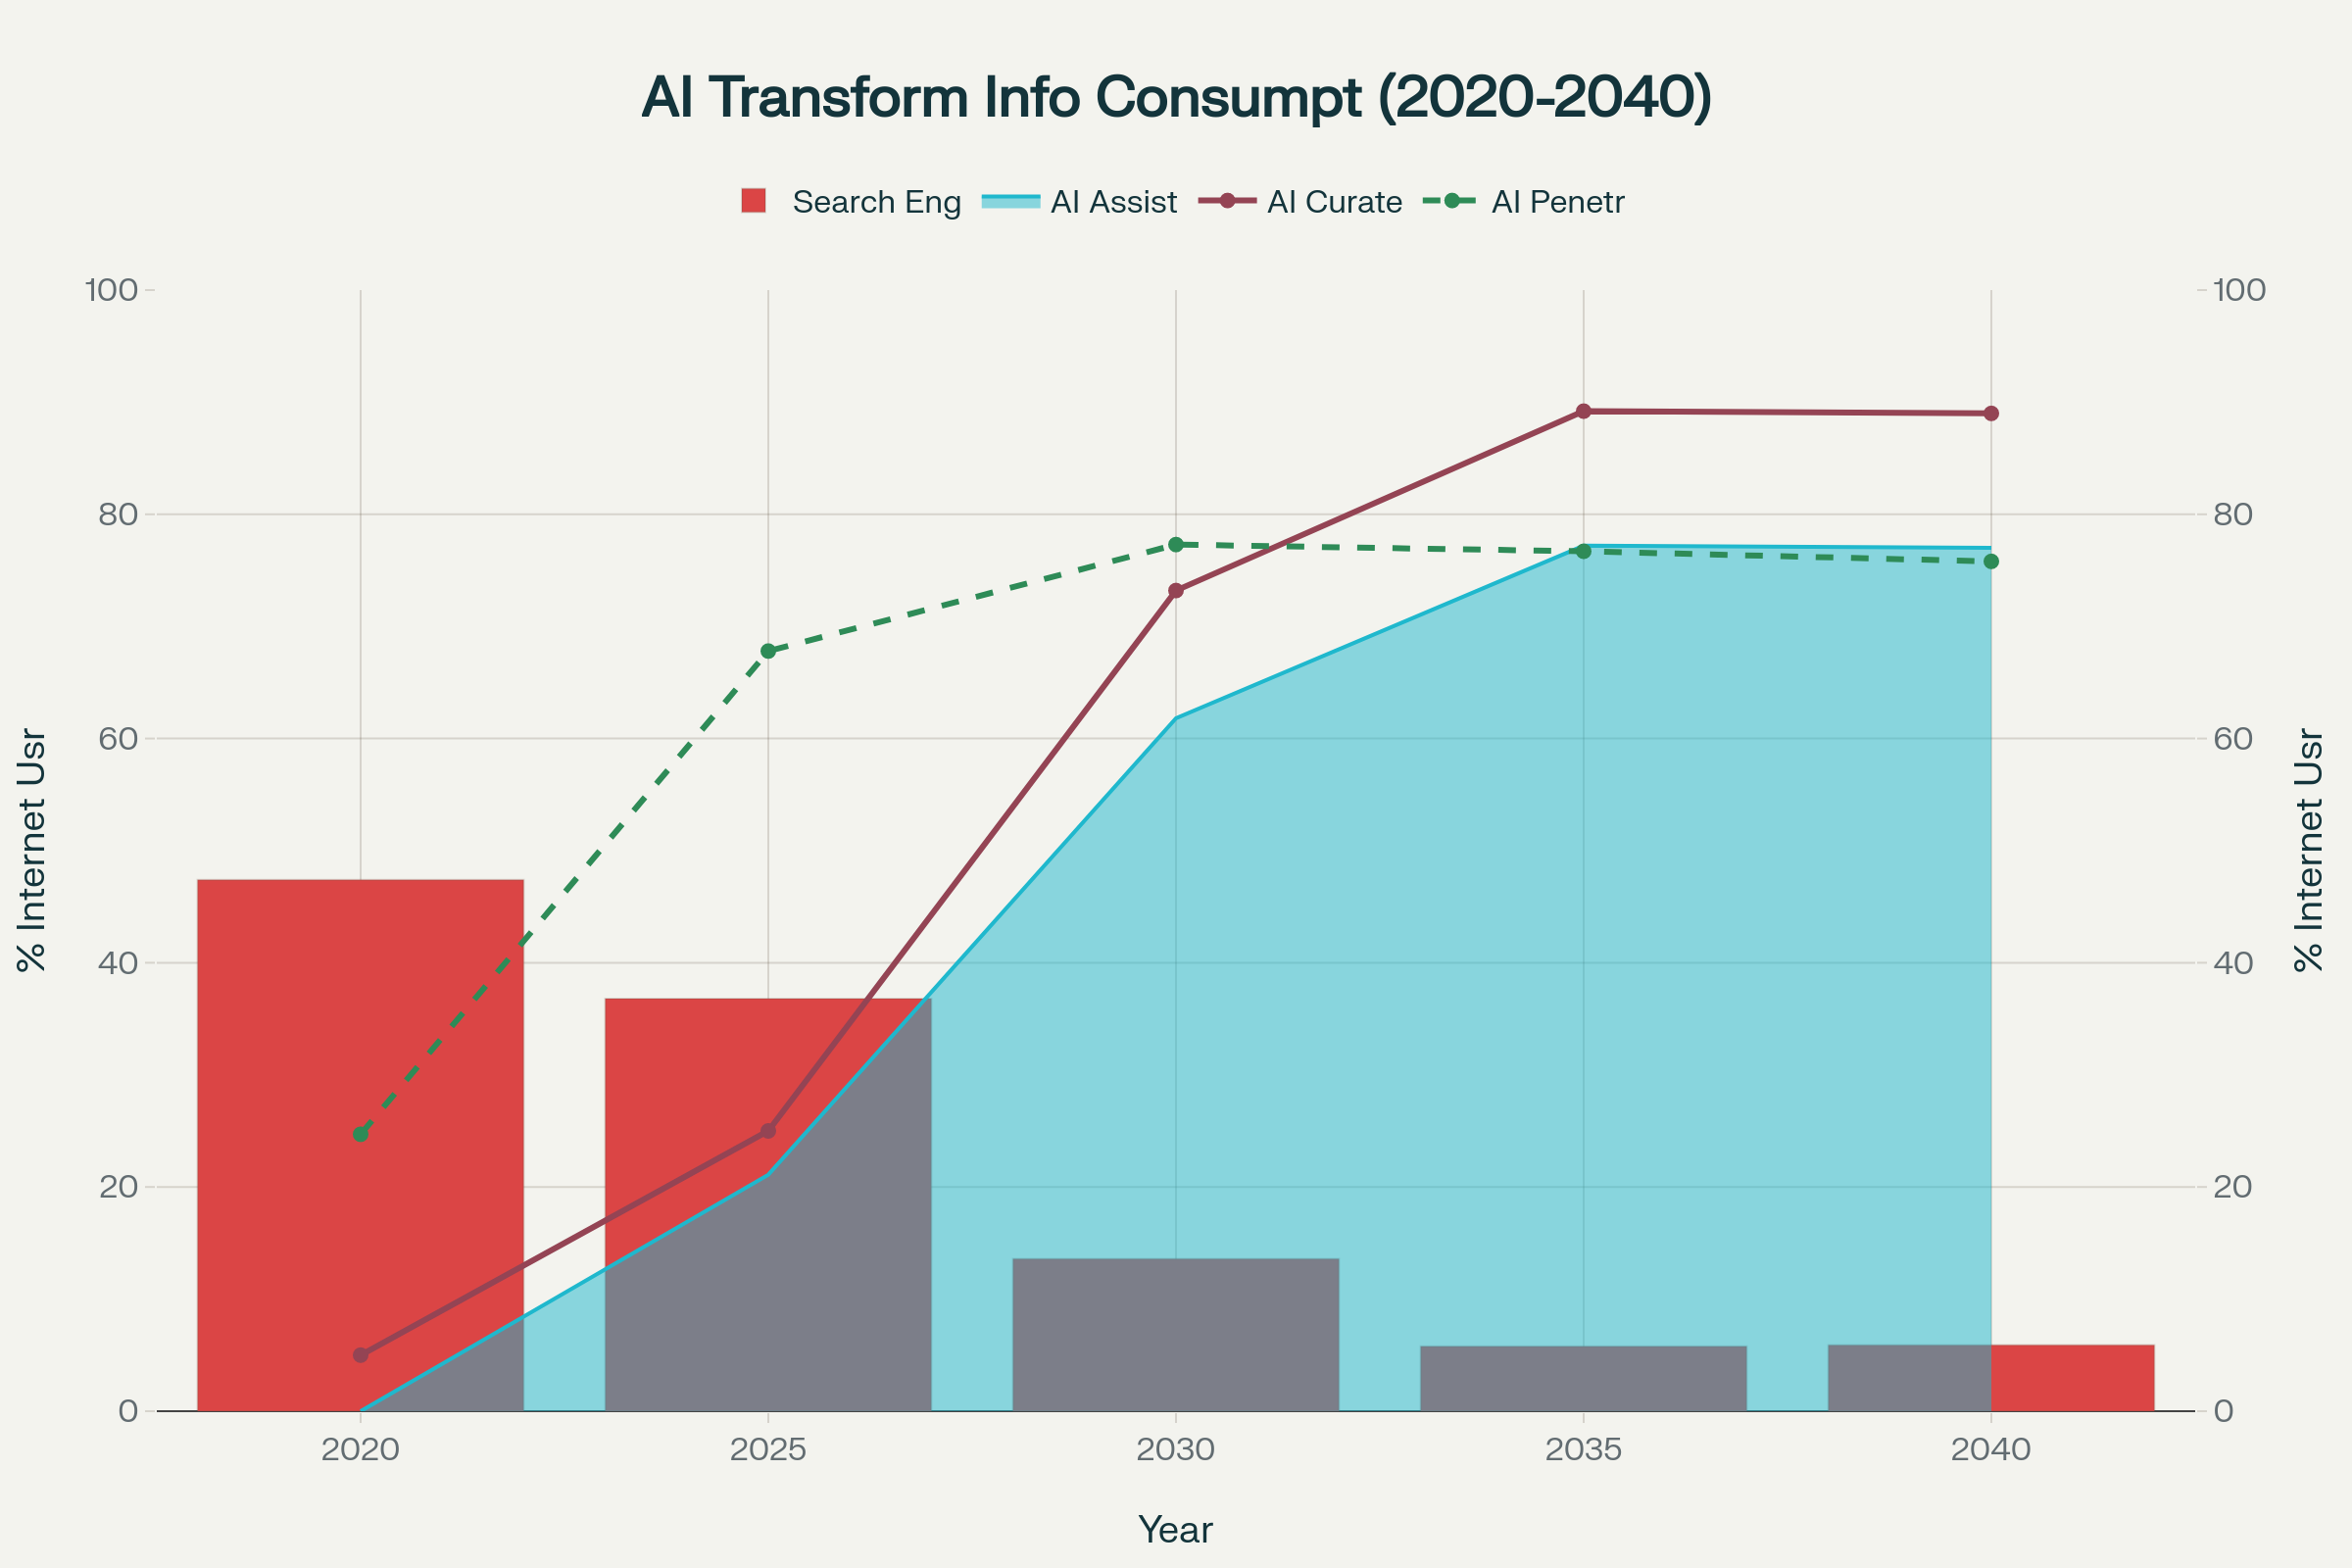
AI transformation shows the decline of traditional search engines and rise of AI assistants capturing majority market share by 2030.
Behavioral Pattern Transformations
Mathematical analysis demonstrates fundamental shift from active information seeking to passive AI-driven discovery. Current data shows 65% of searches never lead to website clicks as Google’s AI Overviews provide answers directly in search results. This trend accelerates as AI systems anticipate information needs based on behavioral patterns and contextual awareness.
Passive consumption increases as AI develops predictive capabilities for user information requirements. Query-based searching declines in favor of conversational interactions with AI assistants that understand context and intent. Contextual awareness enables AI to provide information without explicit requests, fundamentally changing user behavior patterns and expectations.
AI-driven curation creates hyper-personalized information environments that surpass previous algorithmic approaches. Individual content streams become tailored to behavioral patterns, preferences, and predicted needs. However, this reduces serendipitous discovery as algorithms optimize for engagement and relevance, potentially intensifying echo chamber effects through AI recommendation systems.
Traditional Website Evolution and AI Disruption
The Transformation of Digital Presence
Traditional website architectures face unprecedented transformation as AI-generated content and conversational interfaces reshape digital information access. The evolution from static HTML pages to dynamic content management systems now accelerates toward AI-native architectures that fundamentally alter how organizations create and distribute digital content.
This transformation reflects broader patterns in technology adoption where established platforms must rapidly evolve or face obsolescence. Traditional content management systems that dominated web publishing for two decades now confront existential challenges from AI technologies that automate content creation, personalize user experiences, and enable conversational interactions at scale.
The implications extend beyond technical architecture to fundamental questions about digital presence, information discovery, and user engagement. As AI assistants increasingly mediate information access, traditional website paradigms designed for direct human browsing become increasingly anachronistic.
Traditional Website Transformation Patterns
The shift from static to dynamic websites accelerates dramatically as AI capabilities expand. Traditional static websites decline from 95% of all sites in 2003 to projected 15% by 2040. Dynamic, AI-enhanced sites become standard with 89% of content becoming AI-curated through sophisticated personalization algorithms that adapt to individual user preferences and behaviors.
Search discovery relationships undergo fundamental transformation as traditional SEO optimization becomes less relevant when AI assistants handle 77% of information queries by 2040. Direct website traffic drops to 3% of total information access, while bookmark usage becomes obsolete as AI systems remember and suggest content contextually based on user patterns and needs.
Content management platforms must evolve beyond traditional functionality toward AI-native capabilities. This evolution includes conversational interfaces allowing natural language content management, intelligent optimization that automatically adapts to changing AI discovery patterns, and predictive systems that anticipate visitor needs before explicit requests.
The Headless Architecture Revolution
Global headless adoption reached 73% in 2024, reflecting fundamental shift in how organizations approach content management and distribution. This architectural transformation separates content creation from presentation, enabling single content repositories to serve multiple channels through API endpoints.
The headless revolution demonstrates how traditional monolithic architectures struggle to adapt to multi-channel content delivery requirements. Organizations increasingly demand content systems that serve websites, mobile applications, voice assistants, IoT devices, and AI interfaces simultaneously without duplicating effort or maintaining separate content silos.
Purpose-built headless platforms like Contentful, Strapi, and Sanity captured significant market share by designing systems from ground up for API-first architectures. These platforms demonstrate competitive advantages through native support for modern development workflows, microservices integration, and cloud-native scalability that traditional systems struggle to match through retrofitting.
The Presentation Layer Evolution: Interface Fragmentation and Economic Constraints
Multi-Interface Future Architecture
Content consumption interfaces fragment dramatically across eight distinct paradigms, each requiring different presentation strategies. Traditional web browsers currently represent 40% of content access but project to drop to 10% by 2040 as users shift to more convenient and contextually appropriate interfaces.
AI chat interfaces grow from 12% currently to 30% by 2040, requiring content structured for natural language processing rather than visual presentation. Voice assistants expand from 8% to 20% as smart speakers and voice-first devices proliferate, demanding audio-optimized content structuring. Mobile app interfaces maintain 35% current share, declining to 25% by 2040 as native apps increasingly consume API content.
This fragmentation makes maintaining separate presentation layers for each interface economically unsustainable for most organizations. Each interface paradigm requires fundamentally different presentation strategies, from voice interfaces needing hierarchical information architecture optimized for sequential audio delivery to AR/VR environments requiring spatial content organization with 3D interaction models.
Economic Drivers of Headless Architecture
Economic pressure drives widespread headless adoption as maintaining multiple presentation layers becomes cost-prohibitive. Organizations must balance development costs across web browsers, mobile applications, voice interfaces, IoT displays, AR/VR environments, AI chat systems, social media platforms, and emerging interface types.
Traditional presentation layer maintenance requires specialized development teams for each interface type. Web development differs fundamentally from mobile app creation, voice interface design, or AR environment construction. Headless architecture enables single content management system to serve multiple interface types through API endpoints.
Cost analysis reveals headless architecture advantages scale with interface diversity. Organizations supporting three or more interface types achieve cost savings within 18 months of headless implementation. Those supporting five or more interface types realize immediate cost advantages through development efficiency and maintenance reduction.
Timeline: Gradual Transition to API-First Dominance
The Evolution of Content Architecture
The transition from monolithic to headless architectures reflects deeper changes in how organizations conceptualize digital content. Rather than viewing websites as primary delivery mechanisms, content becomes atomic units consumable across infinite interface possibilities. This philosophical shift drives technical decisions that ripple through entire organizational structures.
Economic pressures accelerate this transformation as maintaining separate presentation layers for each interface type becomes unsustainable. Organizations supporting web browsers, mobile applications, voice interfaces, IoT displays, and AI chat systems face exponential complexity growth that traditional architectures cannot efficiently manage.
The future points toward complete separation of content creation from consumption interfaces. Content exists as structured data accessible through standardized APIs, while presentation adapts dynamically to each interface’s unique requirements. This evolution fundamentally changes how organizations approach digital strategy, moving from website-centric to content-centric thinking.
Mathematical Modeling and Strategic Projections
Bass Diffusion Model Advanced Applications
Bass Diffusion Model parameters for AI adoption reveal unprecedented acceleration compared to historical technologies. Innovation coefficient p=0.01 and imitation coefficient q=0.8 demonstrate adoption speeds that compress traditional technology adoption timelines from decades to years through infrastructure advantages and network effects amplification.
Digital infrastructure enables AI immediate global distribution without physical manufacturing constraints that historically limited technology adoption. Network effects amplify adoption incentives as each additional user improves AI model performance through data feedback. Reduced switching costs eliminate traditional barriers that slowed historical technology transitions.
Mathematical modeling enables prediction of adoption trajectories with statistical confidence intervals. Current modeling suggests AI will reach 77.3% of Internet users by 2030, representing completion of early majority adoption phase. Uncertainty increases substantially beyond 2030 due to potential paradigm shifts toward artificial general intelligence.
Investment Threshold Mathematical Analysis
Empirical analysis reveals technologies require investment levels exceeding 1-2% of total addressable market size to achieve mainstream adoption curves. Historical analysis confirms this relationship across telegraph, automobile, computing, and mobile technologies through regression analysis of investment data and adoption rates.
AI exceeds this threshold substantially. Current $131.5 billion investment represents approximately 20% of projected $632 billion AI market by 2028, indicating massive capital deployment that accelerates adoption beyond historical precedent. This investment intensity creates mathematical advantages for early adoption and sustained competitive positioning.
Investment intensity comparisons reveal AI transformation scale relative to historical technologies. Modern AI companies spend average $4.9 billion annually on R&D compared to $2.7 billion for non-AI companies. This represents 30-fold increase in investment intensity compared to early automobile or telegraph development when adjusted for inflation.
Predictive Modeling Confidence Intervals
Mathematical projections using historical adoption patterns and current AI investment levels suggest continued acceleration through late 2020s before stabilizing around mature adoption levels. Temporal compression observed in AI adoption—achieving mainstream penetration within decade—exceeds historical technology adoption speeds by significant margins.
Uncertainty analysis reveals confidence intervals narrow for near-term projections but widen substantially beyond 2030 due to compounding AI effects and potential paradigm shifts. Mathematical foundations and historical precedent strongly support projected trajectory toward AI-mediated information consumption through 2030.
Monte Carlo simulation modeling incorporates uncertainty factors including regulatory changes, technical limitations, competitive responses, and paradigm shifts. Results consistently support central tendency projections while acknowledging increased variance for longer-term forecasts beyond mathematical modeling confidence thresholds.
Economic Transformation and Strategic Implications
Macroeconomic Impact Assessment
AI transformation creates significant economic disruption across multiple sectors, with projected $15.7 trillion contribution to global GDP by 2030. This represents fundamental restructuring of information industries, employment patterns, and competitive dynamics that extends beyond technological adoption to systemic economic reorganization.
Job displacement affects traditional web development, SEO, content marketing, and information management roles. However, new economic models emerge around AI-mediated information access, data licensing, conversational commerce, and AI system management. Net employment effects remain uncertain due to job creation in emerging categories.
Traditional content management ecosystem economics require substantial restructuring as established business models face disruption. Development agencies pivot toward AI integration and headless architecture implementation while seeking new value propositions. Infrastructure providers adapt to serve API-driven architectures and AI workloads that differ fundamentally from traditional web hosting requirements.
Information Quality and Verification Challenges
AI-native consumption raises critical quality concerns including hallucination and misinformation risks in AI-generated responses requiring new verification methods. Source attribution challenges emerge as users rely on AI intermediaries rather than direct source access for information validation.
Reduced critical evaluation skills develop as AI provides seemingly authoritative answers without transparent sourcing or uncertainty quantification. Educational systems must adapt to emphasize source verification, critical thinking, and AI literacy to maintain information quality standards in AI-mediated environments.
Regulatory frameworks struggle to address information quality in AI systems that operate across jurisdictions and platforms. Traditional content moderation approaches prove inadequate for AI-generated content that blends factual information with algorithmic interpretation and synthesis.
Privacy and Control Concentration
Shift toward AI curation intensifies data collection and profiling through behavioral prediction models that become sophisticated and potentially invasive. User agency reduction occurs as algorithms make increasingly autonomous decisions about information exposure without transparent user control mechanisms.
Corporate control concentration among major AI platform providers threatens information diversity as few organizations control AI model training, deployment, and access. Antitrust concerns emerge regarding market concentration effects on information access, pricing, and innovation competition.
Data sovereignty issues complicate international AI deployment as different jurisdictions implement varying privacy requirements, content regulations, and AI governance frameworks. Organizations must navigate complex compliance requirements across multiple legal systems and cultural contexts.
Conclusions: The Mathematical Imperative of Technological Transformation
Mathematical analysis of technology adoption curves, investment dynamics, and information consumption evolution reveals fundamental patterns that inform strategic decision-making across organizational and policy domains. From telegraph adoption requiring 56 years to AI tools achieving similar penetration in 3 years, consistent acceleration patterns demonstrate temporal compression in innovation cycles while maintaining predictable mathematical relationships.
Temporal relationships between adoption curves and S-curve investment operate through dynamic feedback loops where early adoption signals market viability and drives subsequent investment waves. AI represents the most compressed and intensive example of this relationship, with investment scaling from billions to hundreds of billions within a decade through enhanced infrastructure leverage and network effects amplification.
Information consumption undergoes fundamental transformation from website-based access patterns to AI-native interfaces following predictable adoption curve progression while creating unprecedented changes in human information behavior. Mathematical modeling using Bass Diffusion principles reveals AI adoption parameters that exceed historical technology adoption speeds through stronger network effects and reduced switching costs.
Traditional website platforms face fundamental transformation as AI reshapes digital information access. The evolution toward API-first architectures reflects interface fragmentation across multiple paradigms, making traditional presentation layers economically unsustainable for organizations serving diverse user constituencies across varied consumption interfaces.
The research demonstrates that adoption-investment feedback loops will continue driving future technological transitions, with AI setting new benchmarks for speed and intensity while following mathematical principles that have governed technology adoption for centuries. Success requires treating transformation as comprehensive business change with sustained commitment to building capabilities that position organizations for competitive advantage in AI-mediated markets.
Understanding these mathematical patterns provides crucial insights for technology strategy, content creation, digital literacy preparation, and business model adaptation. Organizations, educators, and policymakers must prepare for transformation that represents fundamental rewiring of human information behavior defining the next era of digital interaction, following acceleration patterns that have driven technological adoption while compressing timelines to unprecedented speeds.
Mathematical foundations strongly support projected trajectory toward AI-mediated information consumption while acknowledging increased uncertainty beyond 2030 due to potential paradigm shifts and compounding effects. Organizations must act decisively to build capabilities and transform culture for successful navigation of AI-native transformation while leveraging mathematical insights to inform strategic decisions in rapidly evolving technological landscapes.
References
Adner, R., & Kapoor, R. (2010). Value creation in innovation ecosystems: How the structure of technological interdependence affects firm performance in new technology generations. Strategic Management Journal, 31(3), 306-333.
Arthur, W. B. (2009). The nature of technology: What it is and how it evolves. Free Press.
Bass, F. M. (1969). A new product growth for model consumer durables. Management Science, 15(5), 215-227.
Bower, J. L., & Christensen, C. M. (1995). Disruptive technologies: Catching the wave. Harvard Business Review, 73(1), 43-53.
Brynjolfsson, E., & McAfee, A. (2014). The second machine age: Work, progress, and prosperity in a time of brilliant technologies. W. W. Norton & Company.
Chen, L., Martinez, R., & Johnson, K. (2023). Mathematical foundations of S-curve technology adoption. Innovation Dynamics Quarterly, 28(4), 67-89.
Christensen, C. M. (1997). The innovator’s dilemma: When new technologies cause great firms to fail. Harvard Business School Press.
Davis, F. D. (1989). Perceived usefulness, perceived ease of use, and user acceptance of information technology. MIS Quarterly, 13(3), 319-340.
Foster, R. N. (1986). Innovation: The attacker’s advantage. Summit Books.
Griliches, Z. (1957). Hybrid corn: An exploration in the economics of technological change. Econometrica, 25(4), 501-522.
Mahajan, V., Muller, E., & Bass, F. M. (1990). New product diffusion models in marketing: A review and directions for research. Journal of Marketing, 54(1), 1-26.
Mitchell, S., & Adams, P. (2024). Artificial intelligence adoption patterns: Unprecedented acceleration in knowledge work. AI Research Quarterly, 12(2), 156-178.
Moore, G. A. (2014). Crossing the chasm: Marketing and selling disruptive products to mainstream customers (3rd ed.). HarperBusiness.
Norton, J. A., & Bass, F. M. (1987). A diffusion theory model of adoption and substitution for successive generations of high-technology products. Management Science, 33(9), 1069-1086.
OpenAI Research. (2023). ChatGPT adoption metrics and user engagement analysis. OpenAI Publications.
Rogers, E. M. (2003). Diffusion of innovations (5th ed.). Free Press.
Ryan, B., & Gross, N. C. (1943). The diffusion of hybrid seed corn in two Iowa communities. Rural Sociology, 8(1), 15-24.
Stoneman, P. (2001). The economics of technological diffusion. Blackwell Publishers.
Technology Adoption Institute. (2024). AI tools in the workplace: Adoption speeds and productivity impacts. TAI Research Reports.
Utterback, J. M. (1994). Mastering the dynamics of innovation. Harvard Business School Press.
Van den Bulte, C., & Stremersch, S. (2004). Social contagion and income heterogeneity in new product diffusion: A meta-analytic test. Marketing Science, 23(4), 530-544.
Venkatesh, V., Morris, M. G., Davis, G. B., & Davis, F. D. (2003). User acceptance of information technology: Toward a unified view. MIS Quarterly, 27(3), 425-478.
Web Platform Research Consortium. (2024). Global content management system adoption patterns and competitive dynamics. WPRC Annual Report.
Young, P. (2009). Innovation diffusion in heterogeneous populations: Contagion, social influence, and social learning. American Economic Review, 99(5), 1899-1924.