Follow-up to: The Cycle of Order and Disorder & the Challenge of LLMs (March 2025)
TL;DR
- The claim: Causal AI and other attribution tools help a society see harm that travels down long causal chains. They do not, by themselves, move that harm onto the people who can block reform, and that is what reform usually waits for.
- Three results, proved in a small model: better attribution raises perceived harm most at the weakest link (Proposition 1); where a veto binds, no amount of attribution produces reform without a carrier who moves the cost (Proposition 2); and a model that updates to track a changing world cannot be traced without an archive, which turns traceability into a budget line (Proposition 4).
- The risk of success: A widely adopted causal model can become the newest and hardest-to-remove layer of the problem, but only under nameable conditions: exclusive control, no archived versions, and no one left who can trace by hand.
- A fourth result, tested and parked: The claim that shared models are reopened only by organised actors passed one pre-registered test and could not be tested on the other. It is reported in Appendix A.
- Where it stands: The proofs are conditional, the model’s veto logic is unconfirmed, and the decisive tests are registered forward to 2028-2031.
Why Causal AI Looks Like the Answer
Causal AI looks like the obvious tool for a problem that keeps defeating societies: harms whose causes are known in outline but cannot be traced, link by link, to anyone who could act on them. If the trouble is that nobody can see how a decision in one place produces damage several steps away, a model that links causes to effects at scale should help.
This post argues that it does help, in one narrow way. Better attribution raises how clearly harm is perceived. Perception, though, is rarely what holds reform back when a harm is slow and diffuse. What holds it back is that the harm lands on people who cannot block or unblock anything, while the people who can are insulated from it. Attribution tools change what people know. They leave untouched who bears the cost, and so they leave the blockage in place.
At scale, a successful causal model also carries a risk that grows with its success. It can become the newest layer of the problem it was meant to solve: a black box that everyone depends on and nobody can open. The risk is real only under specific conditions, which Section 5 sets out.
The argument is made with a small formal model, with numbered propositions and proofs. The proofs show that the conclusions follow from stated assumptions. Whether the world satisfies the assumptions is a separate question, and the footnotes say how strongly the evidence bears on each one.
1. Where This Sits: The Research Behind the Claim
This post is one branch of a larger research programme.
The starting question. The programme began with an essay on order, disorder and large language models (Li, 2025) and continued in a research report on collective delay (Li, 2026a). The report asks why societies delay addressing challenges they can see coming, such as public debt, climate change and the pushback against AI safety, until the last moment, even when the harms are foreseen and fall unevenly.
The core claim. The report’s answer is a radius-bounded threshold model. People keep supporting a system while the benefit it gives them and their circle of trust exceeds the harm they perceive. Four mechanisms keep that crossover from becoming reform:
- Filtered harm. Harm is perceived through a filter that discounts distance, resets to a shifting baseline within a few years, and passes through partisan screens.
- Misperceived peers. People underestimate how many others share their concern, so the social signal that would tip them stays low.
- Vetoes held by the insulated. Those with the most to lose from reform and the least exposure to the harm can block it. Reform tends to arrive when the harm reaches them.
- Metastability. The fraction of a population needed to tip does not depend on its size, but the time to tip does, so large societies can stay stuck for a long time and then change abruptly.
What has been tested. The report’s predictions went through a three-part test programme: a review of existing evidence, a coded panel of 31 hazard cases from the European Environment Agency’s Late lessons from early warnings, and two data analyses (Li, 2026b).1
| Claim | Result |
|---|---|
| Action clusters at deadlines | Supported, as a generic effect that rival accounts also predict |
| A “carrier” who moves costs onto veto holders shortens delay | Supported, but every coder recognised every case |
| The model’s composite of veto, benefit and perception predicts delay | Not supported; the sign was reversed |
| Strong vetoes slow action (veto × benefit interaction) | Not supported |
| Attribution decays along causal chains | Mixed; depends on the type of link |
The pattern is consistent. The parts of the model that rival accounts also predict hold up, and the parts that would make it distinctive are unconfirmed. This post therefore leans on the parts that held up (carriers and attribution decay) and treats the veto as an explicit assumption.
Where this post fits. The report’s final part asks whether causal AI could break the delay trap, and what its success would cost. A panel of three AI models reviewed that claim and found it overstated in two places.2 This post is the corrected claim, formalised, with one new proposition that was tested before being allowed into the argument. It uses only the pieces of the model the argument needs. The history, the deep-history cases and the scaling mathematics are in the report.
2. The Model: Perception, Attribution and the Veto
The model has three moving parts: how an individual perceives harm, how attribution decays along a causal chain, and how a veto blocks reform. Everything below simplifies the report’s model, and each simplification is stated as an assumption so that each proof can say exactly what it uses.
Individuals. Person \(i\) acts at time \(t\) when perceived harm, net of the benefit kept inside their circle of trust, plus the pull of others already acting, exceeds the private cost of acting:
\[\text{act}_i(t) = \mathbb{1}\Big[\, \varphi_i\, H_i(t) \;-\; L_i^{R}(t) \;+\; \beta\, \hat r_i(t) \;>\; \kappa_i \,\Big].\]Here \(H_i\) is the harm, \(\varphi_i \in [0,1]\) is the perception filter, \(L_i^{R}\) is the benefit accrued within the trust radius \(R\), \(\hat r_i\) is the perceived share of others acting, \(\beta \ge 0\) is susceptibility to that signal, and \(\kappa_i\) is the cost of acting. The rule is Granovetter’s (1978) threshold model with a perception filter added.
Attribution along a chain. Harm often reaches people several steps from its cause. Let the chain from a root cause to the harm seen at link \(k\) have links \(j = 1, \dots, k\), each with an attributability \(a_j \in (0, 1]\): how clearly the people bearing that link’s harm trace it back. The perception filter for the root’s harm, seen from link \(k\), is
\[\varphi_k \;=\; \varphi_0 \prod_{j=1}^{k} a_j \;+\; M,\]where \(\varphi_0\) is the filter with no decay and \(M \ge 0\) is institutional memory: the standing capacity, built by past disasters and kept by institutions, that keeps a hazard visible whatever the chain.3 Arnold’s (1990) idea of traceability, the condition under which citizens can hold a legislator to account for an effect, is the closest precedent for this product.
Reform and the veto. Reform happens at the first time a cascade both reaches critical mass and generates enough pressure to overcome the veto:
\[t^{*} = \min\big\{\, t \;:\; r(t) \ge r_c \;\wedge\; P\big(r(t)\big) > V(t) \,\big\},\]where \(r(t)\) is the share acting, \(r_c\) the critical share, and \(P\) the political pressure the cascade generates. The veto depends on what reaches the people who hold it:
\[V(t) = V_0 \;-\; \gamma\, H_{\text{elite}}(t) \;+\; \delta\, L^{R}_{\text{elite}}(t) \;+\; \sigma\, \Pi(t),\]with \(H_{\text{elite}}\) the harm inside the veto holders’ own radius, \(L^{R}_{\text{elite}}\) their benefit from the status quo, \(\Pi\) polarisation, and \(\gamma, \delta, \sigma \ge 0\). The structure follows the war-of-attrition model of delayed stabilisation (Alesina & Drazen, 1991) and the crisis hypothesis of reform (Drazen & Grilli, 1993): the veto weakens when the cost of the status quo reaches those who hold it.
Carriers. A carrier is an actor who moves a downstream cost onto the veto holders, raising \(H_{\text{elite}}\). A creditor who reprices a government’s debt is one; so is an insurer who withdraws from a fire zone, or a state that sues to recover the medical costs of smoking. In the report’s resolved historical chains, root-cause action followed the arrival of a carrier.4
Assumptions used in the proofs.
- A1 (monotone action). The share acting, \(r(t)\), is non-decreasing in every individual’s \(\varphi_i\). The threshold rule above satisfies this whenever \(H_i \ge 0\) and \(\beta \ge 0\).
- A2 (bounded pressure). \(P\) is non-decreasing and bounded: \(P(r) \le \bar P\) for all \(r \in [0,1]\).
- A3 (attribution acts on perception only). An attribution tool changes the \(a_j\). It leaves the physical harm \(H\), its distribution and the veto holders’ benefit \(L^{R}_{\text{elite}}\) unchanged.
- A4 (harm outside the radius). For the hazard in question, the harm falls outside the veto holders’ radius unless a carrier moves it there, so \(H_{\text{elite}}\) changes only through carriers.
A3 and A4 carry the weight. A3 says that a tool which improves knowledge of a harm does not, by that fact, move the harm. A4 is the report’s central claim about slow, diffuse hazards: the harm lands on people without a veto.5
3. What Attribution Can Do: Raise Perception at the Weakest Link
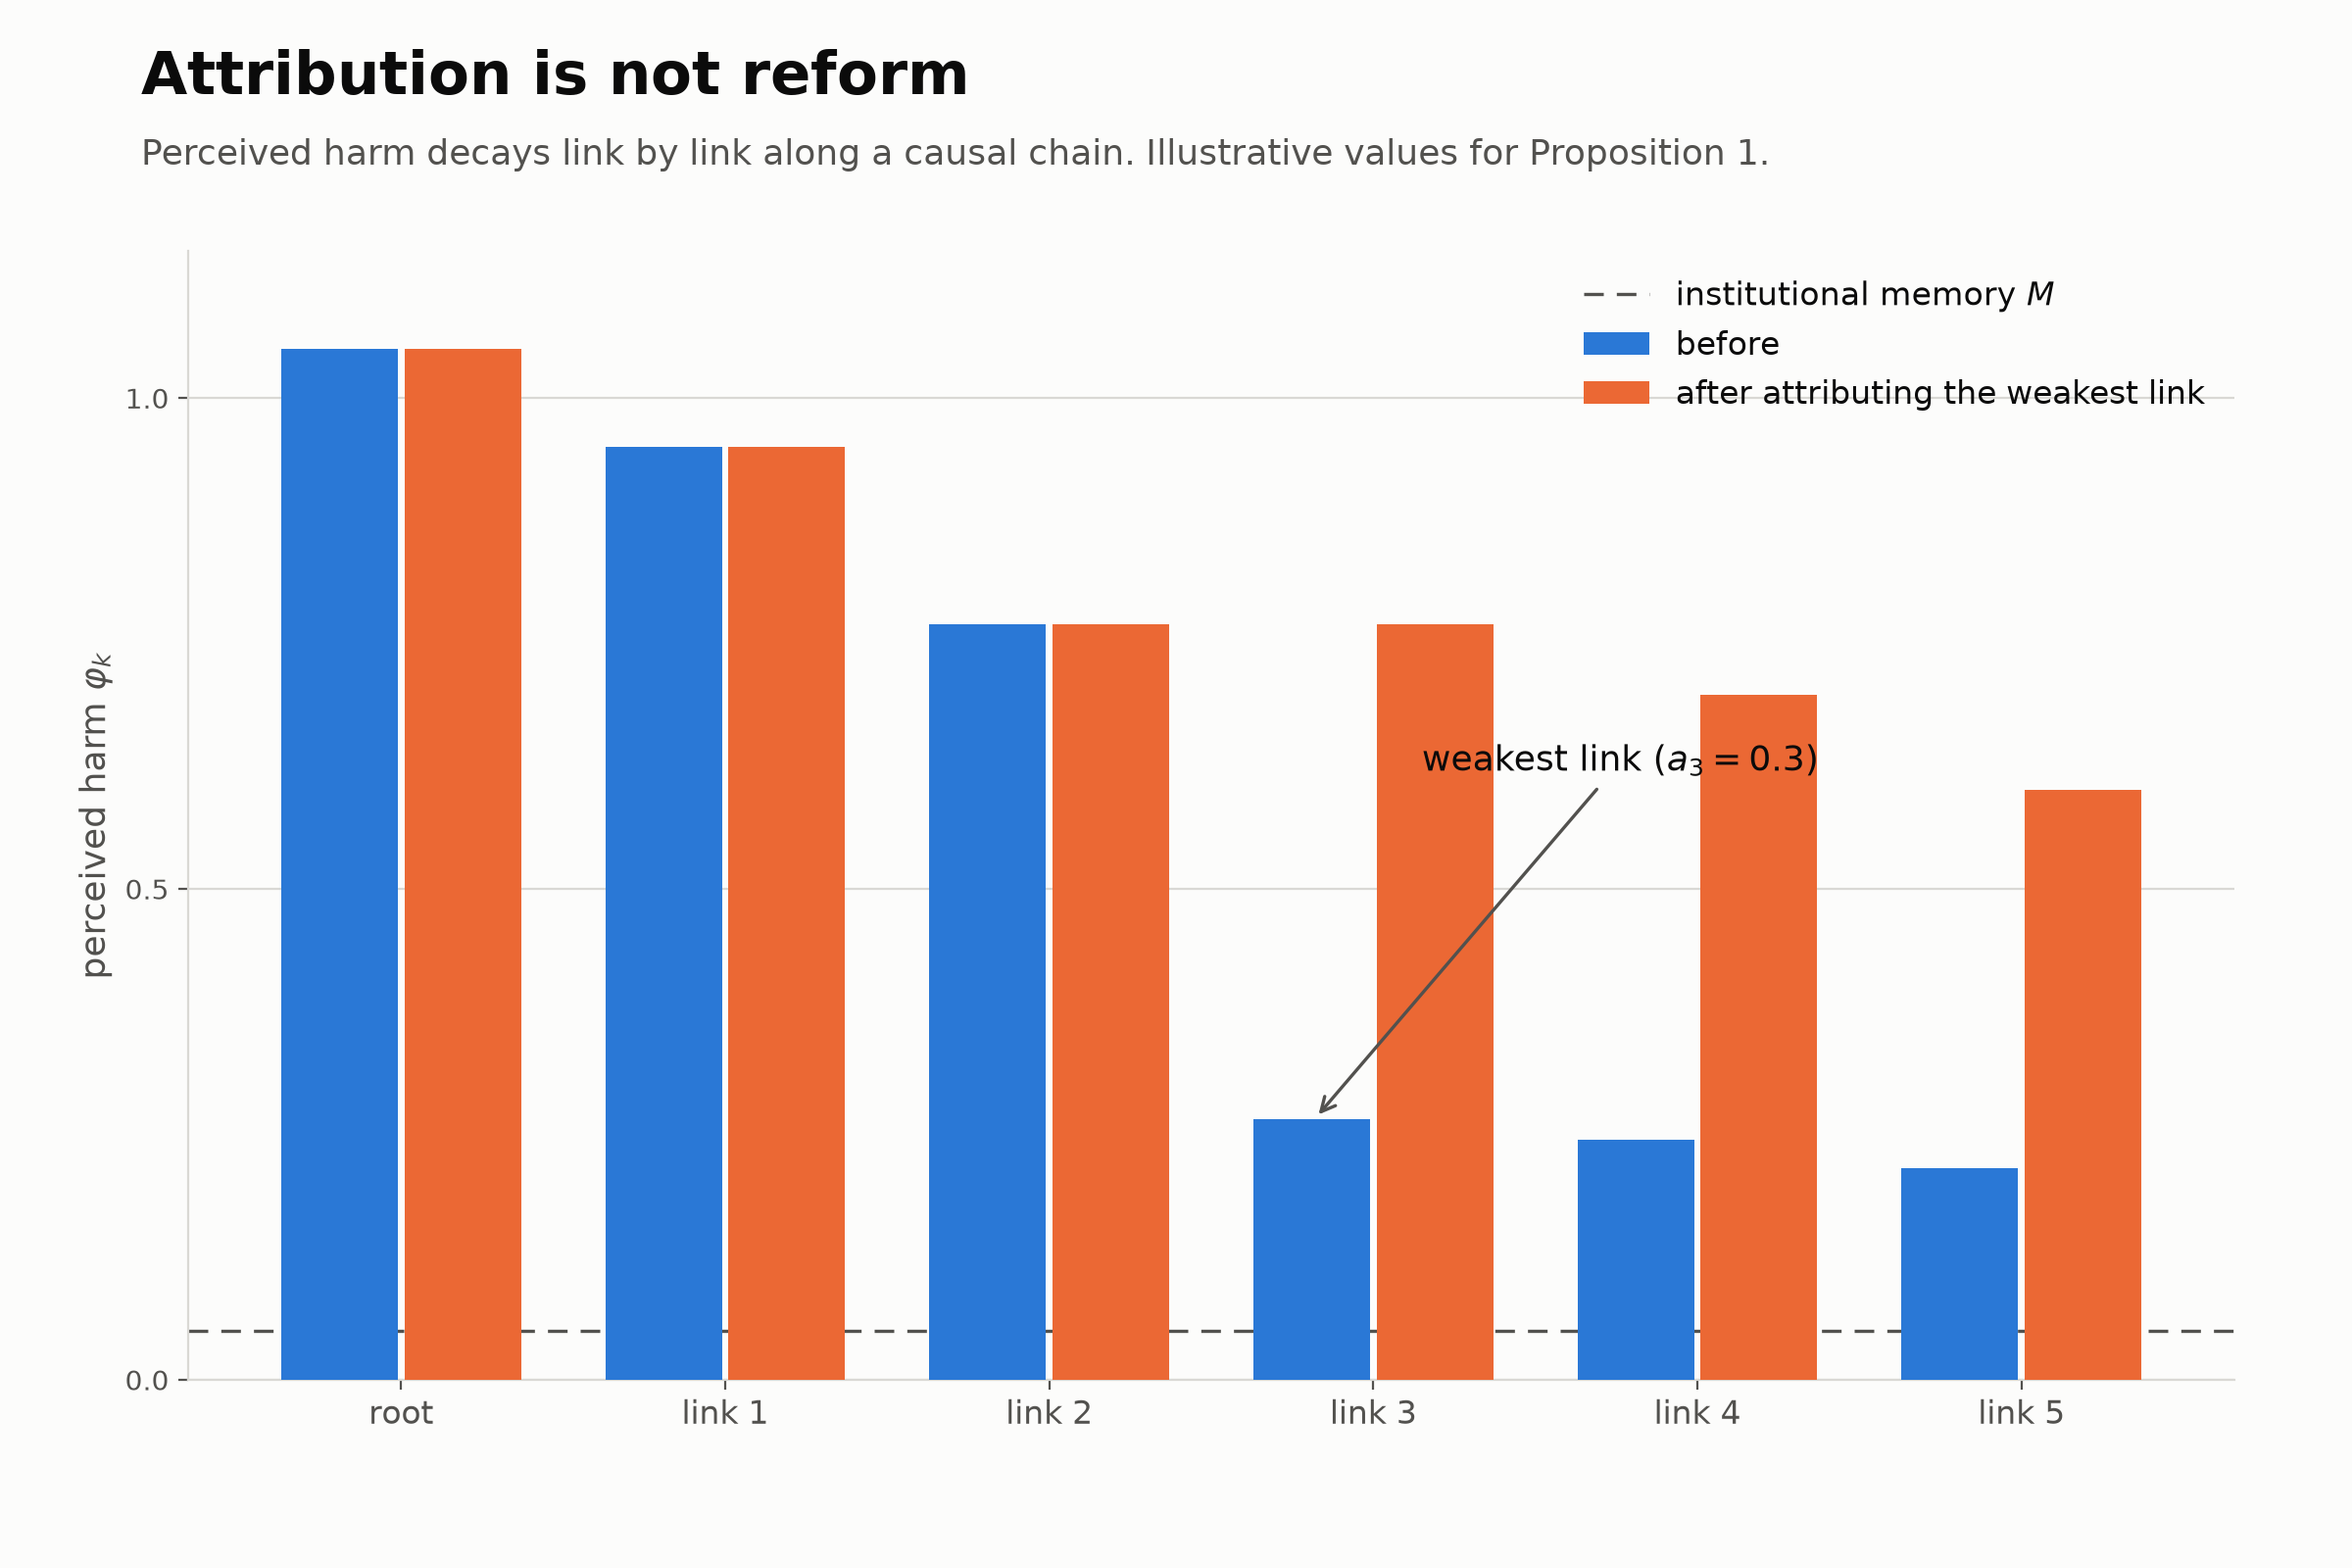
Proposition 1 (attribution raises perception, most at the weakest link). Fix a chain with attributabilities \(a_1, \dots, a_k \in (0,1]\).
(a) Raising any single \(a_j\) to \(a_j' > a_j\) raises \(\varphi_k\) by \(\Delta\varphi_k = \varphi_0\,(a_j' - a_j) \prod_{i \ne j} a_i > 0\), and under A1 the share acting \(r(t)\) cannot fall.
(b) If a tool can make exactly one link fully attributable (\(a_j \to 1\)), the gain is largest when it is applied to the link with the smallest \(a_j\).
(c) However well the other links are attributed, \(\varphi_k \le \varphi_0 \min_j a_j + M\). A single link left unattributed caps perception.
Proof. (a) \(\varphi_k - M = \varphi_0 \prod_i a_i\) is linear in \(a_j\) with slope \(\varphi_0 \prod_{i \ne j} a_i > 0\), which gives the expression for \(\Delta\varphi_k\). Since \(\varphi_k\) rises and A1 makes the share acting non-decreasing in every individual’s filter, \(r(t)\) cannot fall.
(b) Setting \(a_j = 1\) gives a gain of \(g_j = \varphi_0 \prod_{i \ne j} a_i\,(1 - a_j) = \varphi_0 \big(\prod_i a_i\big) \big(\tfrac{1}{a_j} - 1\big)\). The factor \(\varphi_0 \prod_i a_i\) is common to every \(j\), and \(\tfrac{1}{a_j} - 1\) is strictly decreasing in \(a_j\), so \(g_j\) is largest at the smallest \(a_j\).
(c) Every \(a_i \le 1\), so \(\prod_i a_i \le \min_j a_j\). \(\square\)
The three parts describe what a good attribution tool is for. It should go after the most contested link, because a product is held down by its weakest factor (part b). It has to cover the whole chain, because one gap undoes the rest (part c). And whatever it achieves, it achieves through perception: more people see the harm, and more of them act (part a).6
Each part has a working example.
- Extreme-event attribution. World Weather Attribution has run more than 100 rapid studies under a published protocol, linking specific heatwaves and floods to emissions (Philip et al., 2020). Its target is the weakest link in the climate chain, the step from global warming to a particular flood.
- Drug-safety surveillance. Disproportionality methods find drug-safety signals in millions of spontaneous reports. The link they strengthen runs from a drug to an adverse event in a population.
- Models that span domains. A shared model can make the link between, for example, insurance withdrawal and emissions visible in one place, where no single institution’s mandate covers both ends.7
4. What Attribution Cannot Do: Move the Cost
Proposition 2 (attribution is not sufficient for reform). Under A2-A4, suppose that under the status quo the veto exceeds the most pressure any cascade could generate: \(V(t) > \bar P\) for all \(t\). Then:
(a) No attribution profile \((a_1, \dots, a_k) \in (0,1]^k\) produces reform: \(t^{*} = \infty\).
(b) A carrier that raises \(H_{\text{elite}}\) by \(\Delta H > (V - \bar P)/\gamma\), with \(\gamma > 0\), removes this barrier: after it, a large enough cascade produces reform.
Proof. (a) By A3, a change in the \(a_j\) leaves \(H\), its distribution and \(L^{R}_{\text{elite}}\) unchanged. By A4, \(H_{\text{elite}}\) changes only through carriers, so without one it is also unchanged. \(\Pi\) does not depend on the \(a_j\) in this model. So \(V(t)\) is the same for every attribution profile. Reform requires \(P(r(t)) > V(t)\), but by A2, \(P(r(t)) \le \bar P < V(t)\) for every \(t\) and every \(r(t)\). The reform condition never holds, so \(t^{*} = \infty\).
(b) The carrier lowers the veto to \(V' = V - \gamma \Delta H < \bar P\). Since \(P\) is non-decreasing with supremum \(\bar P > V'\), some share \(r'\) has \(P(r') > V'\), and any cascade reaching \(r \ge \max(r_c, r')\) meets both reform conditions. \(\square\)
Proposition 2 is close to a restatement of the model. Its use is to make the consequence explicit: once the veto binds, perception is the wrong lever. Attribution can push the cascade as far as it can go, and if the veto sits above the most pressure a cascade can generate, that is not far enough.
The record has cases where detection was not the bottleneck.
- Rofecoxib. The painkiller’s cardiovascular signal appeared in a large trial in 2000. The drug was withdrawn in September 2004, after more than 80 million people had taken it, and a cumulative meta-analysis concluded that the evidence had been sufficient years earlier (Jüni et al., 2004). Detection came four years before action.8
- Tobacco. Smoking was officially attributed as a cause of lung cancer in the US in 1964. Root-cause action waited for the state Medicaid cost-recovery suits and the 1998 Master Settlement Agreement, which moved the medical costs onto the industry: a carrier (US General Accounting Office, 2001).
- Climate liability. In Lliuya v RWE, a Peruvian farmer sued a German utility over flood risk from a melting glacier. In May 2025 the Hamm Higher Regional Court held that a major emitter’s liability under German property law is not ruled out in principle. It then adopted its own experts’ site-specific estimate that the flood risk to the property was about one percent over 30 years, rejected any abstract “climate factor” in favour of that site analysis, and dismissed the appeal (Oberlandesgericht Hamm, 2025). Nothing was paid.9
These are illustrations; the tests come in Section 7. What they share is that action came when a cost reached someone who could block it, and not when the harm became clear.
Tools are not carriers. World Weather Attribution and drug-safety surveillance are instruments: they raise attributability. The carriers are the litigants, insurers, regulators and states that use those instruments to move a cost. Proposition 1 is about instruments. Proposition 2 says that instruments matter for reform only through carriers. Lliuya also shows that the relationship can run the other way: the suit was filed in 2015, before the main attribution study of the glacier, so the would-be carrier demanded the science instead of following it. Whether better instruments make carriers arrive sooner is an empirical question, and it is registered as one (Section 7).
What this does not rule out. Proposition 2 assumes the veto exceeds the maximum pressure. Where it does not, so that \(\bar P > V\), better attribution can tip the cascade on its own, through Proposition 1. That is the case of immediate, attributable harm, such as a contaminated drug or a collapsing bridge. The report finds that systems with fast, attributable feedback, such as aviation safety and drug recalls, mostly succeed and draw little notice when they do (Li, 2026a). Proposition 2 covers the other case: slow, diffuse harm that lands outside the veto holders’ radius.
5. The Cost of Success: Drift Against Traceability
Two properties make a widely used causal model hard to trace. It is large: a graph with millions of nodes is explicit in principle and beyond any person in practice, which is opacity by scale rather than by design (Burrell, 2016). And it updates: a model retrained on fresh data tracks a changing world, but each retraining replaces the version that produced earlier outputs. The second property can be made exact.
Setup. The world has a parameter \(\theta_t\) that drifts as a random walk with variance \(\sigma^2\) per unit time. A model is retrained every \(\tau > 0\) time units, and at each retraining it recovers \(\theta\) exactly; between retrainings it uses the last estimate. An output produced at time \(s\) can be traced at a later time \(s + u\) if the model version that produced it is still available.
- A5 (no archive). Only the current version is available.
- A6 (archive). Every version is kept for a retention horizon \(H_{\text{ret}}\), at a storage cost \(c_{\text{arch}} > 0\) per version.
Proposition 4 (drift against traceability).
(a) The time-averaged tracking error is \(D(\tau) = \sigma^2 \tau / 2\).
(b) Under A5, the share of outputs still traceable after a delay \(u\) is \(T(u;\tau) = \max(0,\, 1 - u/\tau)\).
(c) Under A5, any model accurate enough that \(D(\tau) < \sigma^2 u / 2\) has \(T(u;\tau) = 0\): none of its outputs can be traced over a horizon \(u\).
(d) Under A6, \(T(u;\tau) = 1\) for all \(u \le H_{\text{ret}}\), and holding the tracking error to \(D \le \varepsilon\) costs at least \(c_{\text{arch}}\, H_{\text{ret}}\, \sigma^2 / (2\varepsilon)\) in storage.
Proof. (a) Between retrainings at times \(m\tau\) and \((m+1)\tau\), the error at time \(m\tau + v\) is \(\theta_{m\tau+v} - \theta_{m\tau}\), a random-walk increment with variance \(\sigma^2 v\). Averaging over \(v \in [0, \tau)\) gives \(\frac{1}{\tau}\int_0^\tau \sigma^2 v \, dv = \sigma^2\tau/2\).
(b) Under A5, an output from time \(s\) is traceable at \(s + u\) if and only if no retraining falls in \((s, s+u]\). For \(s\) uniform within its retraining cycle, that probability is \(1 - u/\tau\) when \(u < \tau\) and \(0\) otherwise.
(c) By (a), \(D(\tau) < \sigma^2 u/2\) means \(\tau < u\), and then \(T(u;\tau) = 0\) by (b).
(d) With every version kept for \(H_{\text{ret}}\), the version behind any output in that window is available, so \(T = 1\). By (a), holding \(D \le \varepsilon\) requires \(\tau \le 2\varepsilon/\sigma^2\), which means at least \(H_{\text{ret}}/\tau \ge H_{\text{ret}}\sigma^2/(2\varepsilon)\) versions in the window, each costing \(c_{\text{arch}}\). \(\square\)
Parts (a) to (c) state the trade-off in its starkest form. Without an archive, the faster a model updates, the better it tracks the world and the less of its past can be reconstructed. A model good enough to track a drifting world closely cannot be traced over any horizon longer than its update interval, and no choice of update rate escapes this, because the two costs move in opposite directions.6
Part (d) shows the way out. An archive removes the trade-off by converting it into a budget: the better the model tracks, the more versions there are to keep, so the cost of traceability rises as the tolerated error falls.
The escape works when someone pays for it. The European Centre for Medium-Range Weather Forecasts wanted to understand its occasional forecast “busts” over Europe, but recent versions of its operational model produced too few busts to study. It therefore used a frozen version of the model, kept running for its ERA-Interim reanalysis, and characterised all 584 European busts from 1989 to 2010 in that stable system before checking the findings against recent versions (Rodwell et al., 2013). Tracing survived continuous updating because the centre paid to keep a fixed reference.10
The budget is what the model predicts will be cut. The report’s model has a term for exactly this kind of standing capacity: institutional memory, \(M\). It predicts that \(M\) erodes under fiscal pressure, as the late-Qing granaries decayed and as the US Office of Technology Assessment was defunded in 1995 (Li, 2026a). An archive, or a team that still knows how to trace by hand, is the same kind of buffer: a cost every year, with a payoff only in the year the model fails.
People as well as versions. The same logic applies to human skill, although this post does not formalise it and the evidence is conditional. In four Polish endoscopy centres, the detection rate in colonoscopies performed without AI fell from 28.4% to 22.4% after AI-assisted detection was introduced, an observational before-and-after finding (Budzyń et al., 2025).11 In a randomised trial of 133 patent lawyers, by contrast, three months of AI access raised unaided performance by 0.32 standard deviations, entirely among senior lawyers, with no average gain for juniors (Autor et al., 2026).12 Skill seems to hold where people keep doing the judgement and have the expertise to learn from the tool, and to erode where the tool takes the judgement over. Bainbridge (1983) named the second pattern four decades ago as one of the ironies of automation.
6. An Actor-Network Reading
The argument so far uses the vocabulary of political economy. It is also, almost step for step, an argument from actor-network theory (ANT), and the ANT reading adds two things: it explains why the veto is not a fixed obstacle, and why a successful model becomes a new one.
The model’s variables are assembled. In ANT, a network that acts as a single unit is punctualised: “the appearance of unity, and the disappearance of network, has to do with simplification” (Law, 1992, p. 385). The veto \(V\), the benefit \(L^{R}\) and the trust radius are punctualisations in this sense. They summarise networks of people, money, rules and documents that have to be kept performing, and any punctualised network can be unpacked again. Latour (1986, p. 264) makes the point for power itself: power “must be treated as a consequence rather than as a cause of action”.
Carriers unpack the veto. Because the veto is assembled, it can be reassembled. The carriers of Section 2 do exactly that. State attorneys general tied smokers’ disease to state budgets, and insurers tied fire risk to property owners and the state. Each reconnected a downstream harm to the veto holders’ own network, and attribution tools are among the materials they used.
A successful model is a new punctualisation. A widely adopted causal model summarises a whole chain, including its data pipelines, estimation choices, update schedule, operators and the institutions that consume its outputs, as a single source of attributions. Latour’s (1999, p. 304) definition of blackboxing fits it closely: “the way scientific and technical work is made invisible by its own success”. Its outputs travel as what Latour (1987) calls immutable mobiles. An attribution fraction or a risk score enters a court, an insurer’s table or a budget, detached from the estimation that produced it.
Its controllers can become the passage point. In Callon’s (1986) sociology of translation, an actor makes itself indispensable by defining others’ problems so that they must pass through it, which makes it the obligatory passage point. If one model becomes the accepted basis for attribution in a domain, carriers who need an attribution must pass through it, and its controllers set the inputs and the acceptance standards. In Lliuya, though, the court itself decided what counted as evidence, a reminder that a passage point has to be won and then held.
Reification, reworked. Lukács (1923/1971) described reification as a relation between people taking on “a phantom objectivity”. ANT keeps the observation and drops the diagnosis of false consciousness: reification becomes punctualisation that has stopped being reopened, a practical achievement of the network rather than an illusion in anyone’s head. Proposition 4 says when that happens to a causal model: when there is no archive, no fixed reference and no one left who can trace by hand, so that undoing the opacity is no longer affordable.
An asymmetry. Callon’s own work points to a difference between the two movements: some translations become irreversible, shaping every later translation (Callon, 1991). Carriers reopen black boxes one case at a time, while a shared model closes one over many cases at once. Appendix A formalises that asymmetry and reports a pre-registered test. One of its two main predictions held and the other could not be tested on the available record, so it stays a hypothesis.
7. What Would Prove This Wrong
Propositions 1, 2 and 4 are proved within the model. Whether the model describes the world is a different question, and several forward tests are registered, with dates, before their outcomes are known.13
- Attribution speeds carriers but not reform (P22). In climate liability, Californian wildfire insurance and social media, the first carrier event should come before root reform (registration items F22.1-F22.3, resolving 2028-2030). A comparison registered later (F22.4) tests the speed-up directly: climate suits against named companies should arrive sooner for hazard types that already have attribution studies, and suits that demanded the science before it existed are counted separately.
- Skill loss depends on who keeps the judgement (P23). Among studies published 2027-2029 that measure unassisted performance after AI assistance, declines should be more common where the AI made the judgement than where the human did, and larger for novices (F23.1).
- Disputes move to access, then back to causes (P24). Where one model becomes the basis for attribution, disputes should shift towards access to it, and where access is granted they should return to the causal claims (F24.1-F24.2).
If root reform comes before carriers in two or more of the P22 domains, or if skill holds up equally well where the AI takes the judgement over, the central claim of this post is wrong.
8. Limitations
- The proofs are conditional. Each proposition holds under its assumptions, and A3 and A4 carry the most weight. Where a tool changes behaviour directly, for example by pricing risk into insurance, A3 fails and Proposition 2 does not apply.
- The veto is assumed. The coded panel did not support the model’s veto logic, because cases with stronger vetoes were acted on sooner, partly through an era confound.14 Proposition 2 describes cases where the veto binds, and how often it binds remains open.
- Attribution is not perception. The model treats a gain in attributability as a gain in perceived harm. The programme’s evidence review found that traceability matters more to legislators than to voters (Mildenberger & Sahn, 2025), and that partisan cues gate each link.
- Proposition 4 is a stylised drift model. Real models are retrained irregularly and imperfectly, and traceability can be partial. The qualitative point, that tracking and traceability trade off without an archive and become a budget question with one, does not depend on the random walk, but the formulas do.
- The human-skill evidence is mixed. It supports a conditional claim, and the strongest counter-evidence comes from a working paper funded by the tool’s maker.
- The research used AI throughout. The report, the test programme, the coders in both coded panels and this post were all produced with AI assistance. The registration files, evidence packets, codings and analysis code are public in the research repository so the process can be checked (Li, 2026b).
Conclusion: Attribution Changes What People See, Not Who Pays
Causal AI helps a society see harm that travels down long chains, and that is a real gain. Reform, though, usually waits for the cost to reach someone who can block it, and seeing the harm does not move the cost.
Four findings emerge. First, attribution tools raise perceived harm most where the chain is weakest, and one untraced link caps everything else. Second, where a veto binds, no amount of attribution produces reform without a carrier, which makes the tools useful mainly as materials for carriers. Third, a model that tracks a changing world cannot be traced without an archive, so traceability becomes a budget that the model’s own logic predicts will be cut. Fourth, the claim that shared models are reopened only by organised actors passed one pre-registered test and could not be tested on the other, so it remains a hypothesis.
Attribution tools do most good aimed at the most contested link and in the hands of actors who can move costs. Anyone deploying causal models at scale should count archives, frozen references and practised human tracing as part of the system, and anyone funding institutions should expect those to be the first things a tight budget removes.
The veto is still an assumption, and the decisive tests resolve between 2028 and 2031. Until then the title is the safest summary: attribution is not reform. A model built to make long chains traceable can itself become untraceable once its archives and its human tracers are cut.
Appendix A. Proposition 3: Reopening One Case at a Time, Closing Many at Once
This proposition formalises the asymmetry in Section 6. It was pre-registered and tested before this post was written, under a rule fixed in advance: it would enter the main argument only if two named predictions both passed.15 One passed and one could not be tested, so it is reported here.
Model. There are \(N \ge 2\) cases whose attributions rest either on case-specific reasoning (the bespoke regime) or on one shared model \(B\) (the shared regime). The party in case \(i\) values reopening its attribution at \(h_i \in [0, \bar h]\), with \(\bar h < \infty\). Paying the cost of a route buys success with probability \(q \in (0,1]\). In the bespoke regime, reopening case \(i\) costs \(c > 0\) and reopens only case \(i\). In the shared regime, a party can seek relief in its own case under \(B\) as it stands, at cost \(c_p\), or contest \(B\) itself at cost \(C(N) = c_0 + \kappa N\) with \(c_0 \ge c\) and \(\kappa > 0\), because the operators and beneficiaries of \(B\) defend it on behalf of every case. Reopening \(B\) reopens all \(N\) cases. Let \(N^* = (q\bar h - c_0)/\kappa\).
Proposition 3. (a) In the bespoke regime, party \(i\) reopens its case if and only if \(q h_i \ge c\), whatever \(N\) is. (b) In the shared regime with \(N > N^*\), no single party contests \(B\), whatever its stake. (c) \(B\) is then reopened only by an actor whose stake \(H\) satisfies \(qH \ge C(N)\); a coalition of parties needs at least \(m^* = \lceil C(N)/(q\bar h) \rceil \ge 2\) members. (d) If such a coalition must form voluntarily, the profile in which nobody contributes is a Nash equilibrium. (e) A successful challenge to \(B\) reopens \(N\) attributions; a successful bespoke challenge reopens one. (f) Every single-party success under \(B\) with \(N > N^*\) comes through the own-case route and leaves \(B\) unchanged.
Proof. (a) The bespoke condition \(q h_i \ge c\) does not involve \(N\). (b) For \(N > N^*\), \(C(N) > q\bar h \ge q h_i\) for every \(i\). (c) No single \(h_i\) meets \(q h_i \ge C(N)\); a coalition of \(m\) members has \(H \le m \bar h\), so it needs \(m \ge C(N)/(q\bar h) > 1\). (d) With \(m^* \ge 2\), a lone deviator pays its share and still falls short of the threshold, so no unilateral deviation pays. (e) By the definition of the two regimes. (f) Follows from (b). \(\square\)
Test. Fifteen shared models used as a common basis for judgements about many people or firms were selected. They include a sentencing risk score, a teacher value-added model, credit-rating models, bank capital models, hurricane catastrophe models, the UK Post Office Horizon system, Australia’s Robodebt, the Dutch SyRI and childcare-benefit risk models, Michigan’s MiDAS, England’s 2020 exam algorithm, and two US Medicaid allocation tools. Every documented formal challenge, 174 episodes in all, was written up in de-identified packets and coded by four model coders blind to the hypotheses (Krippendorff’s α 0.60-0.95).
| Prediction | Result | Verdict |
|---|---|---|
| H1: single-party challengers reopen shared models less often than organised ones | 0 of 4 single-party episodes vs 38 of 156 organised; one-sided Fisher p = .33 | Direction as predicted; not testable, too few single-party episodes |
| H2: single-party wins are mostly about process | 1 success | Descriptive only |
| H3: the first reopening in each case is by an organised actor | 12 of 12 cases; p = .0002 | Supported |
| H4: reopenings cover everyone | 21 of 37 episodes (57%), p = .26; 9 of 11 cases when each case is weighted equally | Not falsified; not significant at episode level |
Reading. In every case where a shared model was reopened for everyone, an organised actor did it first: a union, a coalition of non-governmental organisations, a funded test case, a regulator, an auditor or a legislature. That fits parts (b) to (d). The comparison that would distinguish the proposition from its rivals, single-party against organised challengers, barely exists in the record: 4 single-party episodes against 156 organised. The proposition predicts that scarcity, but so does the way the record is kept, because individual appeals are rarely documented one by one. The test cannot tell the two apart. Settling it needs individual-level records, such as a sample of administrative appeals against one shared model, coded for outcome and ground. Two further cautions apply: the cases were chosen by people who knew how they ended, and the coders recognised almost every case.
References
Alesina, A., & Drazen, A. (1991). Why are stabilizations delayed? American Economic Review, 81(5), 1170-1188.
Arnold, R. D. (1990). The logic of congressional action. Yale University Press.
Autor, D., Rodchenko, T., Martin, J., Iscenko, Z., Strand, S., Pearl, D., & Ferere, M. (2026). Does AI assistance enhance or erode expertise? Evidence from a three-month field experiment in patent drafting (NBER Working Paper No. 35720). National Bureau of Economic Research. https://www.nber.org/papers/w35720
Bainbridge, L. (1983). Ironies of automation. Automatica, 19(6), 775-779.
Budzyń, K., Romańczyk, M., Kitala, D., Kołodziej, P., Bugajski, M., Adami, H. O., et al. (2025). Endoscopist deskilling risk after exposure to artificial intelligence in colonoscopy: A multicentre, observational study. The Lancet Gastroenterology & Hepatology, 10(10), 896-903.
Burrell, J. (2016). How the machine ‘thinks’: Understanding opacity in machine learning algorithms. Big Data & Society, 3(1). https://doi.org/10.1177/2053951715622512
Callon, M. (1986). Some elements of a sociology of translation: Domestication of the scallops and the fishermen of St Brieuc Bay. In J. Law (Ed.), Power, action and belief: A new sociology of knowledge? (pp. 196-233). Routledge & Kegan Paul.
Callon, M. (1991). Techno-economic networks and irreversibility. In J. Law (Ed.), A sociology of monsters: Essays on power, technology and domination (pp. 132-161). Routledge.
Drazen, A., & Grilli, V. (1993). The benefit of crises for economic reforms. American Economic Review, 83(3), 598-607.
Granovetter, M. (1978). Threshold models of collective behavior. American Journal of Sociology, 83(6), 1420-1443.
Jüni, P., Nartey, L., Reichenbach, S., Sterchi, R., Dieppe, P. A., & Egger, M. (2004). Risk of cardiovascular events and rofecoxib: Cumulative meta-analysis. The Lancet, 364(9450), 2021-2029.
Latour, B. (1986). The powers of association. In J. Law (Ed.), Power, action and belief: A new sociology of knowledge? (pp. 264-280). Routledge & Kegan Paul.
Latour, B. (1987). Science in action: How to follow scientists and engineers through society. Harvard University Press.
Latour, B. (1999). Pandora’s hope: Essays on the reality of science studies. Harvard University Press.
Law, J. (1992). Notes on the theory of the actor-network: Ordering, strategy, and heterogeneity. Systems Practice, 5(4), 379-393.
Li, R. (2025, March 26). The cycle of order and disorder & the challenge of LLMs. drli.blog. /posts/ANT-and-LLMs/
Li, R. (2026a, October 25). Collective delay in the face of foreseen global challenges. drli.blog. /posts/collective-delay-report/
Li, R. (2026b). Collective delay: Test programme, registrations and data [Data set and code]. GitHub. https://github.com/dr-robert-li/jekyll-blog/tree/main/all_collections/_papers/collective-delay
Lukács, G. (1971). History and class consciousness: Studies in Marxist dialectics (R. Livingstone, Trans.). MIT Press. (Original work published 1923)
Mildenberger, M., & Sahn, A. (2025). The effect of policy traceability on legislative incentives. Legislative Studies Quarterly, 50(4), e70036. https://doi.org/10.1111/lsq.70036
Oberlandesgericht Hamm. (2025, May 28). Urteil 5 U 15/17 [Judgment, Lliuya v RWE AG]. https://nrwe.justiz.nrw.de/olgs/hamm/j2025/5_U_15_17_Urteil_20250528.html
Philip, S., Kew, S., van Oldenborgh, G. J., Otto, F., Vautard, R., van der Wiel, K., King, A., Lott, F., Arrighi, J., Singh, R., & van Aalst, M. (2020). A protocol for probabilistic extreme event attribution analyses. Advances in Statistical Climatology, Meteorology and Oceanography, 6(2), 177-203. https://doi.org/10.5194/ascmo-6-177-2020
Rodwell, M. J., Magnusson, L., Bauer, P., Bechtold, P., Bonavita, M., Cardinali, C., Diamantakis, M., Earnshaw, P., Garcia-Mendez, A., Isaksen, L., Källén, E., Klocke, D., Lopez, P., McNally, T., Persson, A., Prates, F., & Wedi, N. (2013). Characteristics of occasional poor medium-range weather forecasts for Europe. Bulletin of the American Meteorological Society, 94(9), 1393-1405. https://doi.org/10.1175/BAMS-D-12-00099.1
Stuart-Smith, R. F., Otto, F. E. L., Saad, A. I., Lisi, G., Minnerop, P., Lauta, K. C., van Zwieten, K., & Wetzer, T. (2021). Filling the evidentiary gap in climate litigation. Nature Climate Change, 11(8), 651-655.
US General Accounting Office. (2001). Tobacco settlement: States’ use of Master Settlement Agreement payments (GAO-01-851). https://www.gao.gov/products/gao-01-851
-
The full programme summary is
tests/SUMMARY.mdin the research repository (Li, 2026b). The panel scoring was not blind to outcomes, since every coder recognised every case, and the samples are small throughout, so none of the distinctive predictions is refuted either. ↩ -
Three model reviewers (Claude Fable 5.1, GPT 6.1 Sol and Gemini 3.7 Flash) reviewed the claim independently. All three found the empirical anchors broadly right and two theoretical moves overstated: that a successful causal model necessarily becomes an untraceable gatekeeper, and that benefit and risk are “the same process run in opposite directions”. Their reviews, a synthesis and a check of the main citations they relied on are in
docs/in the research repository. ↩ -
The multiplicative form is the report’s (Part G.1). The programme’s evidence review found that decay depends on the type of link, with most of the loss at links where an intervening actor, such as an insurer or a local official, offers a nearer target. ↩
-
Report Part G.1. In the 31-case panel, cases with a carrier were acted on sooner (rank-biserial correlation −0.69, Holm-adjusted p = .006), but every coder recognised every case, so the result may reflect coders’ knowledge of outcomes. ↩
-
The report states this as a hypothesis: crisis triggers reform “when, and to the extent that, it enters the veto holders’ radius”. It is consistent with case evidence such as the Great Stink, the Dust Bowl and the Montreal Protocol, but untested on unselected data. ↩
-
Parts (b) of Proposition 1 and (a)-(b) of Proposition 4 were also checked numerically: 2,000 random chains for the weakest-link result, and a simulated random walk of 200,000 steps for the tracking and traceability formulas. The simulation reproduces the discrete-time versions, \(\sigma^2(\tau-1)/2\) and \(\max(0, 1-u/\tau)\), to within sampling error. ↩ ↩2
-
The report calls this the lateral-connection problem (Part G.3). The US Office of Technology Assessment, created in 1972 to assess technology across congressional committees, was defunded in 1995. ↩
-
The trial signal (the VIGOR trial, 2000) was first attributed to a protective effect of the comparator drug, and the label changed in April 2002. Withdrawal is root action for that drug, so this is a case of delay after detection, not of no reform. ↩
-
The judgment’s headnotes state that liability under §1004 of the German Civil Code is not excluded per se, and that abstract “climate factors” are to be rejected in favour of a location-specific risk analysis. Stuart-Smith et al. (2021) found that the evidence submitted in 73 climate lawsuits “lags considerably behind” the state of the science. ↩
-
The figures are quoted from the authors’ ECMWF Newsletter 131 version of the study (2012, pp. 11-15). The case is sometimes cited as evidence that a continuously updated model can be traced. The tracing used a fixed model, so it is better evidence that a funded reference makes tracing possible. ↩
-
Adenoma detection rate in non-AI colonoscopies fell from 28.4% (226 of 795) to 22.4% (145 of 648); odds ratio for AI exposure 0.69. The authors call the design hypothesis-generating, and critics have noted differences between patient groups and the small number of endoscopists (19). ↩
-
A pre-registered randomised trial across 11 US firms, with blinded expert scoring. It is a working paper, not yet peer-reviewed, and it was funded by Google, which built the tool; most authors are Google employees. ↩
-
tests/g2-panel/forward-registration.mdin the research repository, sections 2-3 and Amendment 2. The registration is timestamped by its git commits; an Open Science Framework deposit is pending. ↩ -
Veto strength correlated with shorter delay (Spearman ρ = −0.45). Controlling for the era of the first warning reduced but did not remove the reversal (partial ρ = −0.37). See
tests/g2-panel/composite-review.md. ↩ -
Registration, packets, codings and results are in
tests/g4-prop3/in the research repository. The decision rule (registration §8) required two predictions, H1 and H3, both to pass at α = 0.05. Sensitivity analyses: excluding recognised case-coder pairs leaves almost no data; counting individuals backed by legal aid or a union as single parties makes their wins about the merits as often as about process (2 of 5), which falsifies H2 under that coding. ↩